
Flourish
Analytics
Build interactive data stories from visualization templates
Editorial discoveryFreemium

0 props
Props are a thank-you from members.
 Full size
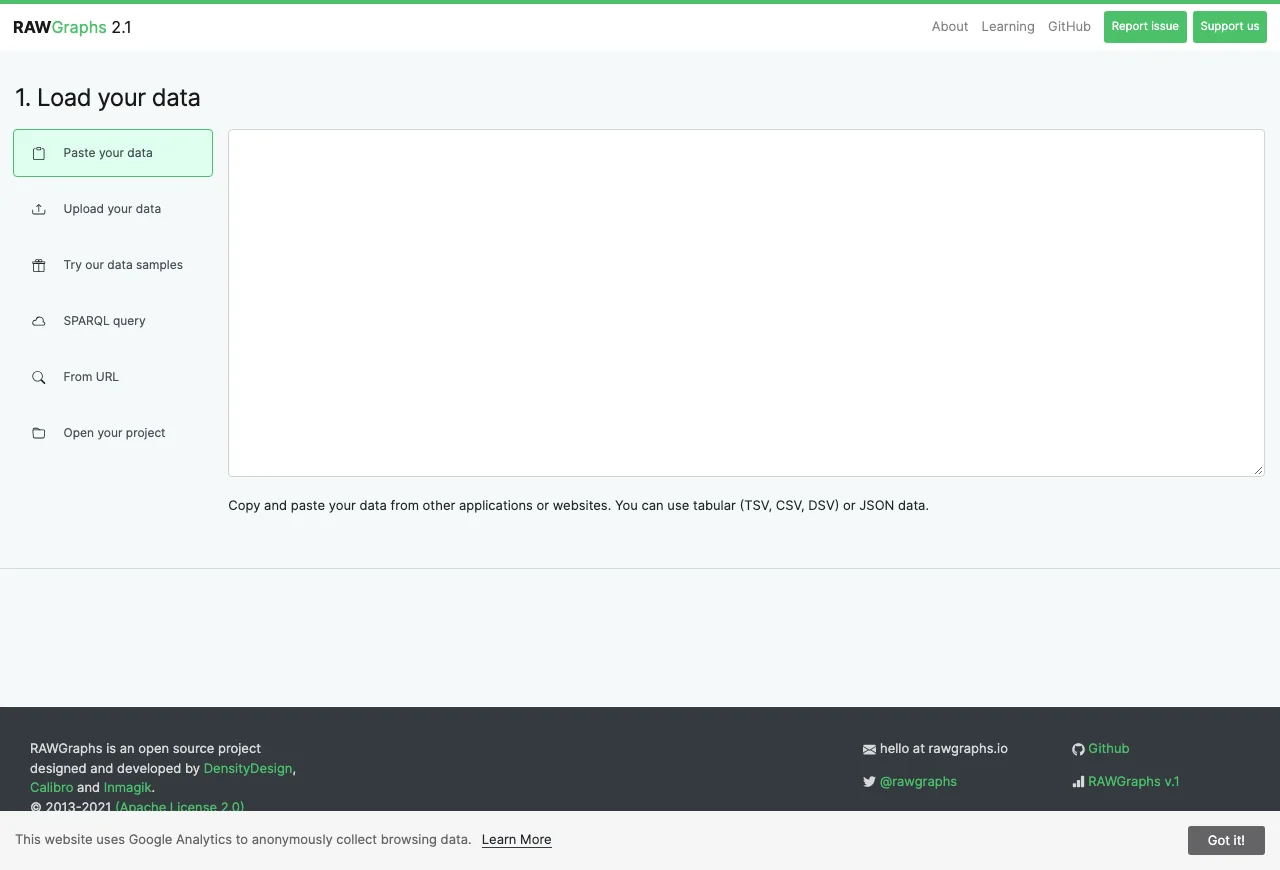
RAWGraphs is a browser tool for mapping tabular data to a chart and exporting the result. Paste a small dataset, assign the fields to chart dimensions and compare how different views express the same relationships. It is useful when you need to go beyond a common spreadsheet chart and want an editable file for design work. Some chart types require a particular data structure, so check the example and reshape your data when needed. Inspect the exported graphic for readable labels and meaningful scales. If the chart will be updated repeatedly, keep the input data and document how you mapped its fields.
Good products deserve a good conversation.
Be the first to start one.
Analytics
Build interactive data stories from visualization templates

Analytics
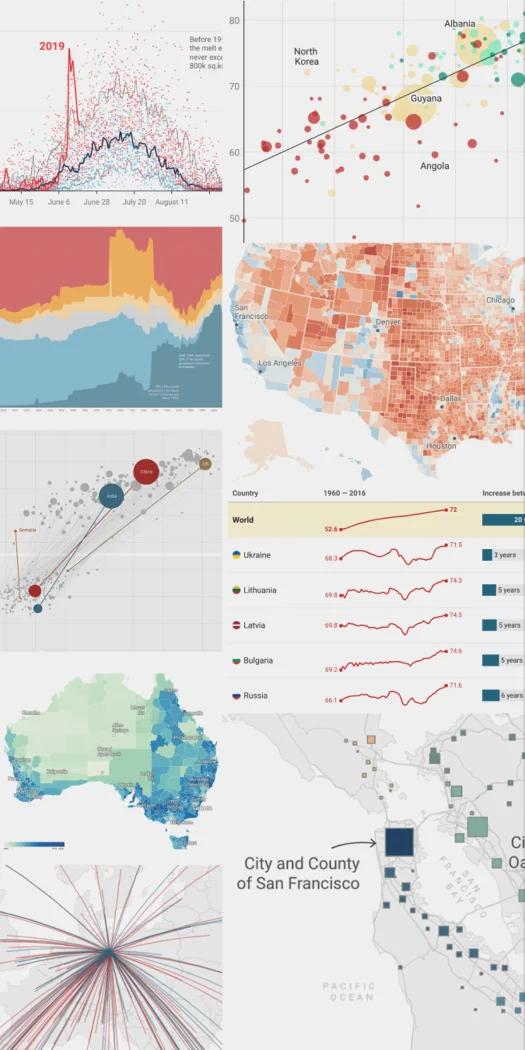
Publish charts, maps and tables for readers on the web

Analytics
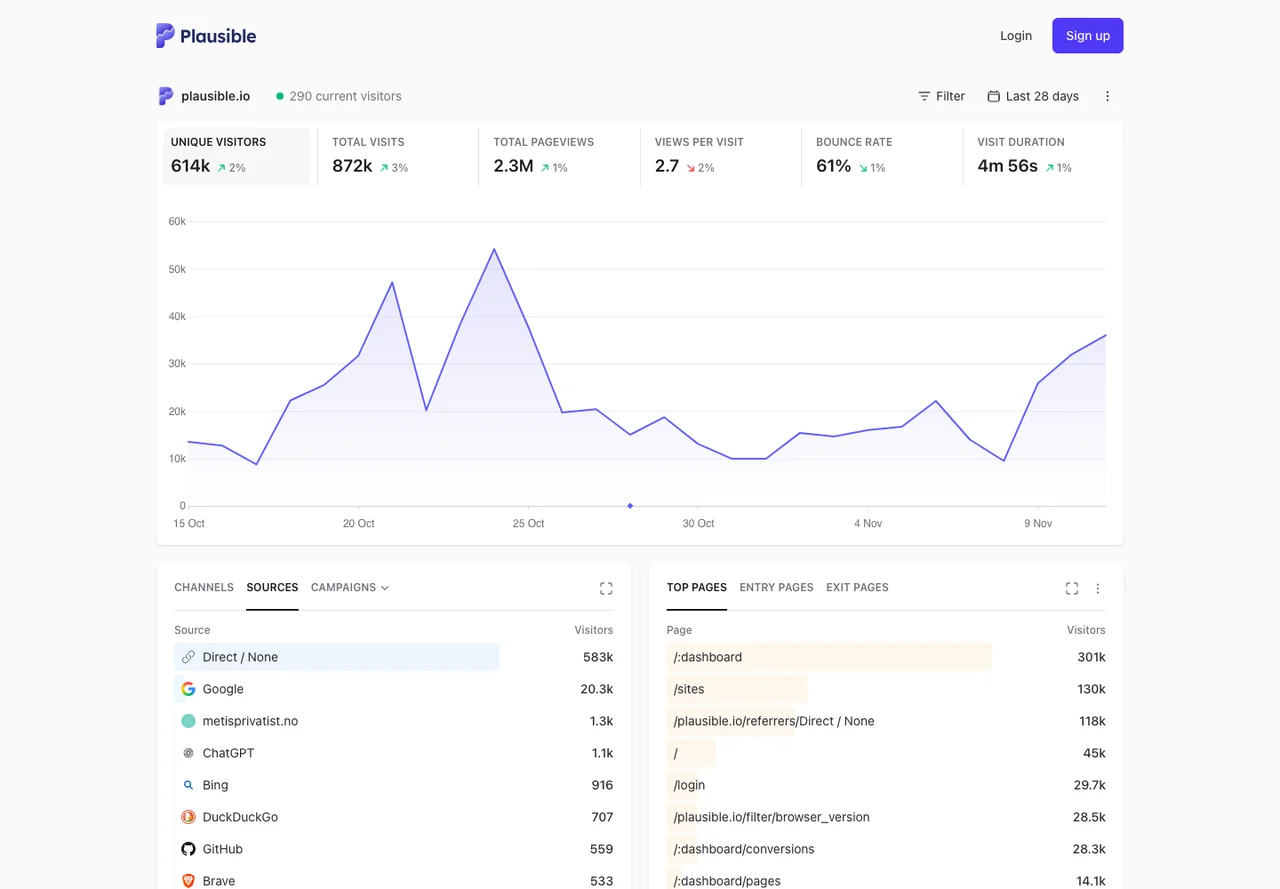
Privacy-friendly website analytics with goals and referrer reports