
Datawrapper
Analytics
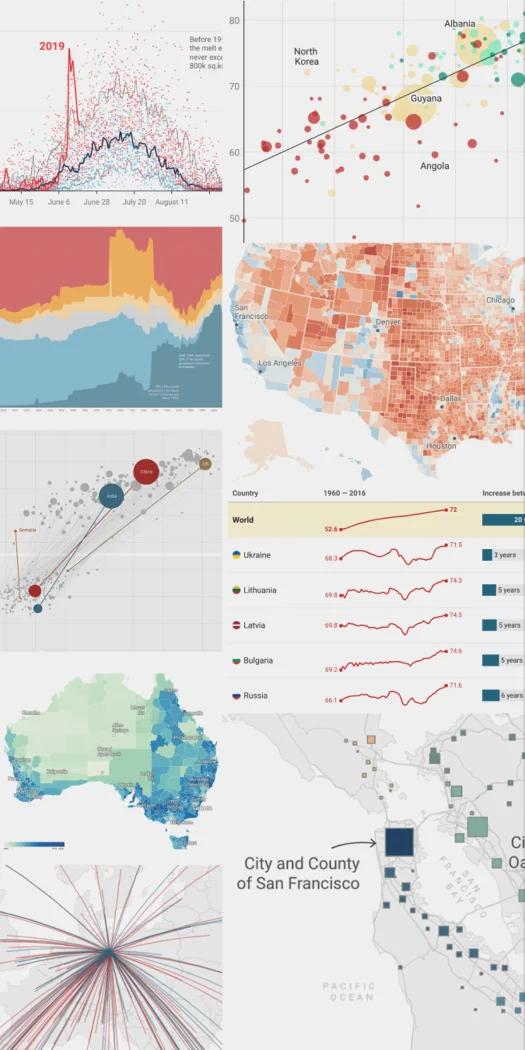
Publish charts, maps and tables for readers on the web
Editorial discoveryFreemium

0 props
Props are a thank-you from members.
 Full size
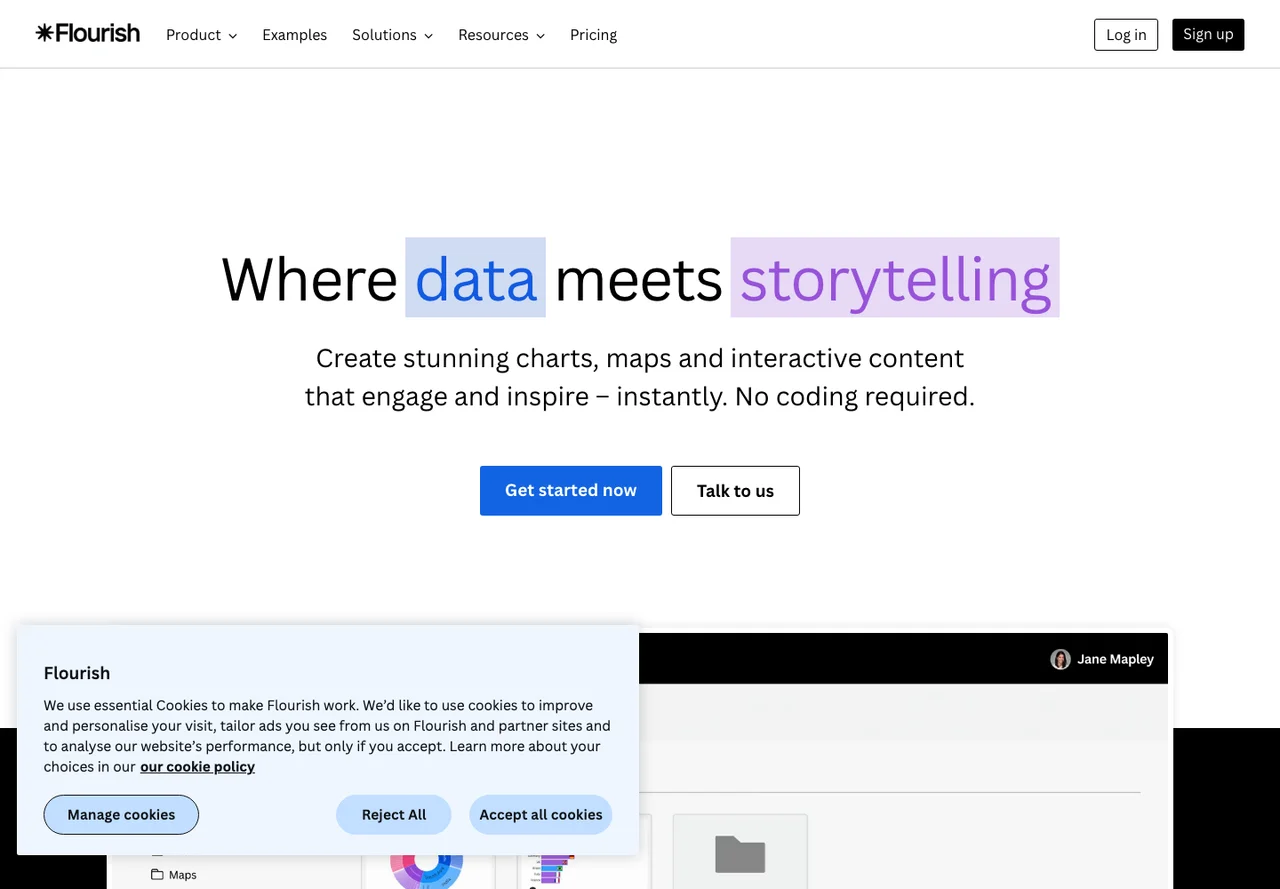
Flourish provides templates for charts, maps and stories that can be published online. Begin with a small dataset and compare a couple of visual forms before investing time in animation or styling. It can be useful when a reader benefits from exploring points or advancing through an explanation at their own pace. The template still needs accurate data and sensible labels. Check what the current plan allows for publishing, exports and collaboration, especially if the dataset should remain private. Preview the finished visual on a phone and test keyboard use or a text alternative when readers need an accessible way to get the same information.
Good products deserve a good conversation.
Be the first to start one.
Analytics
Publish charts, maps and tables for readers on the web

Analytics
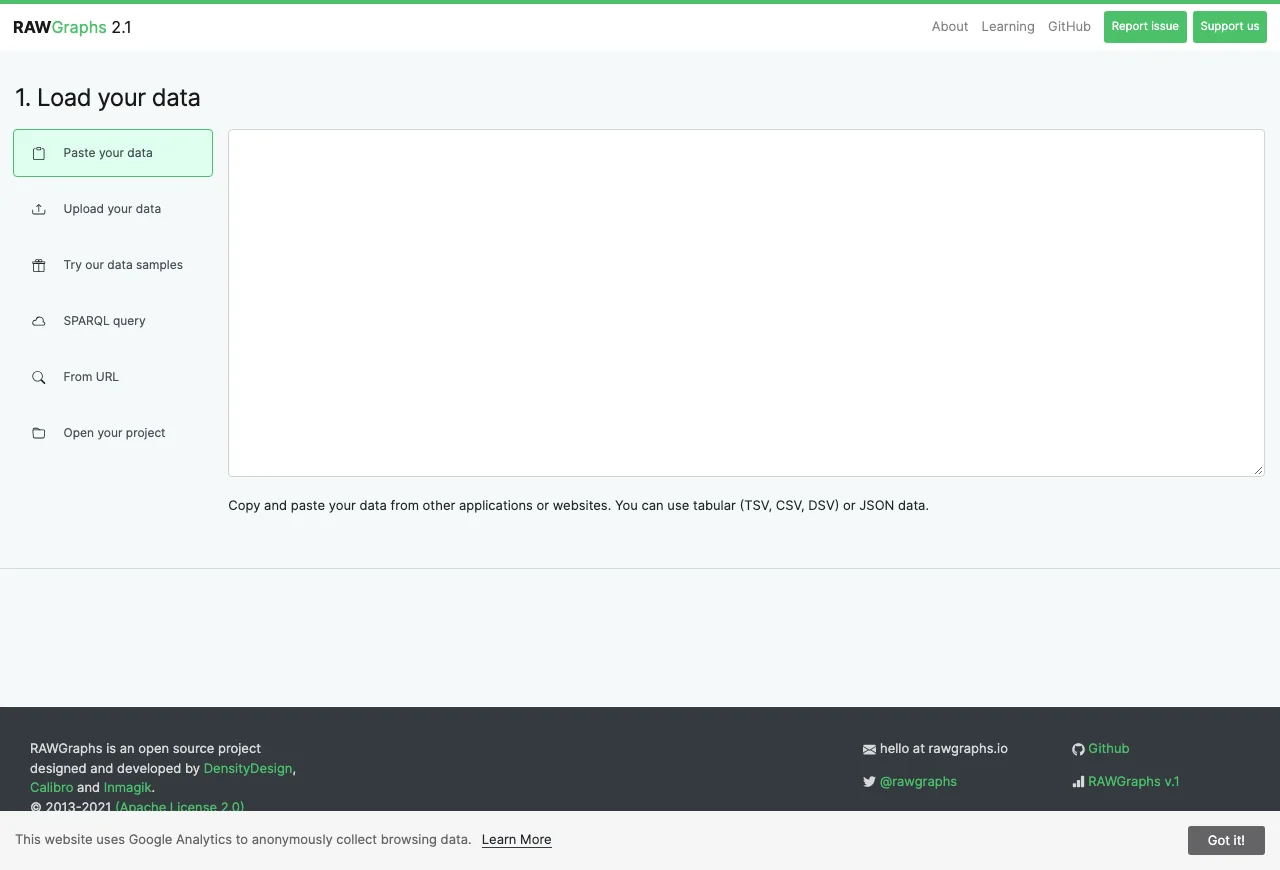
Make data visualizations and export editable graphics

Analytics
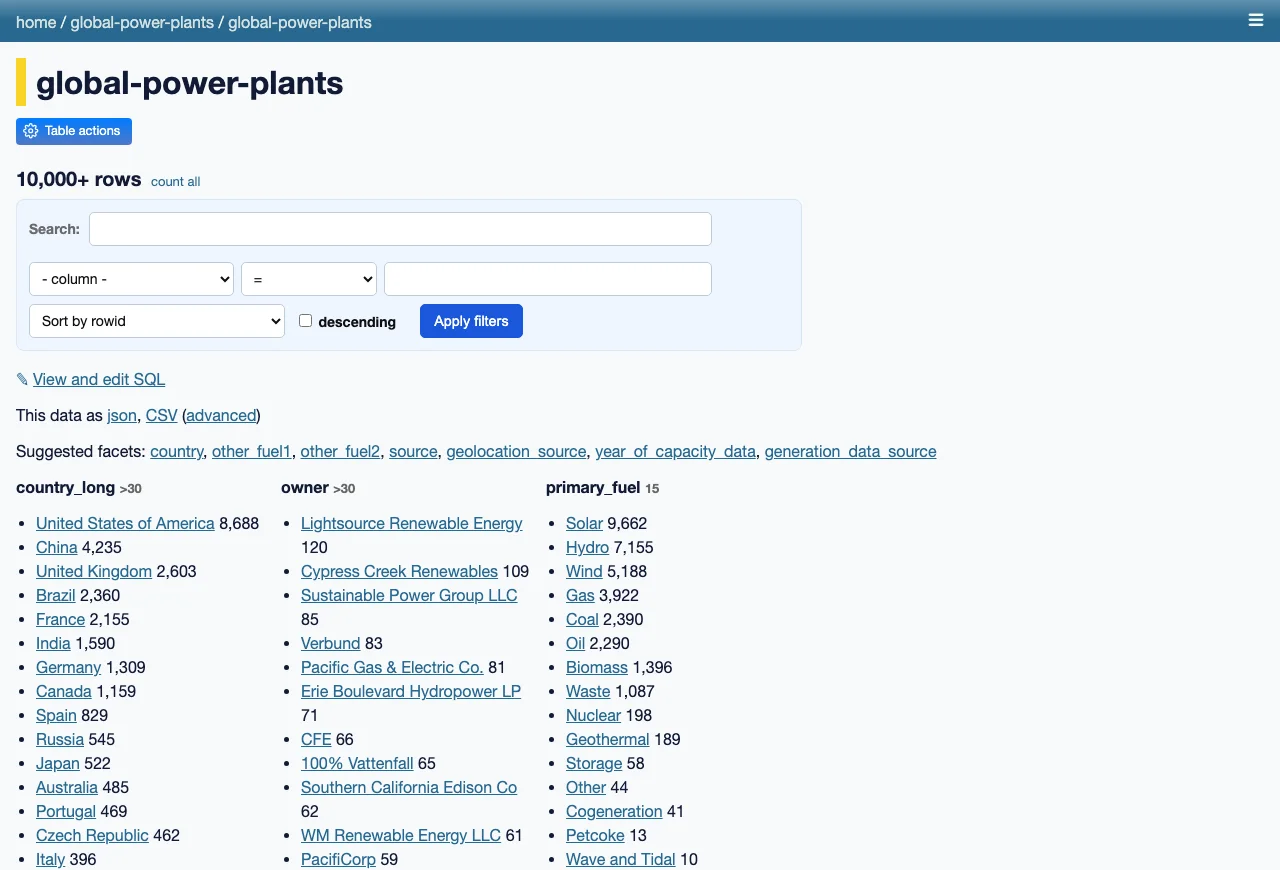
Browse and publish SQLite datasets from a web interface