
Flourish
Analytics
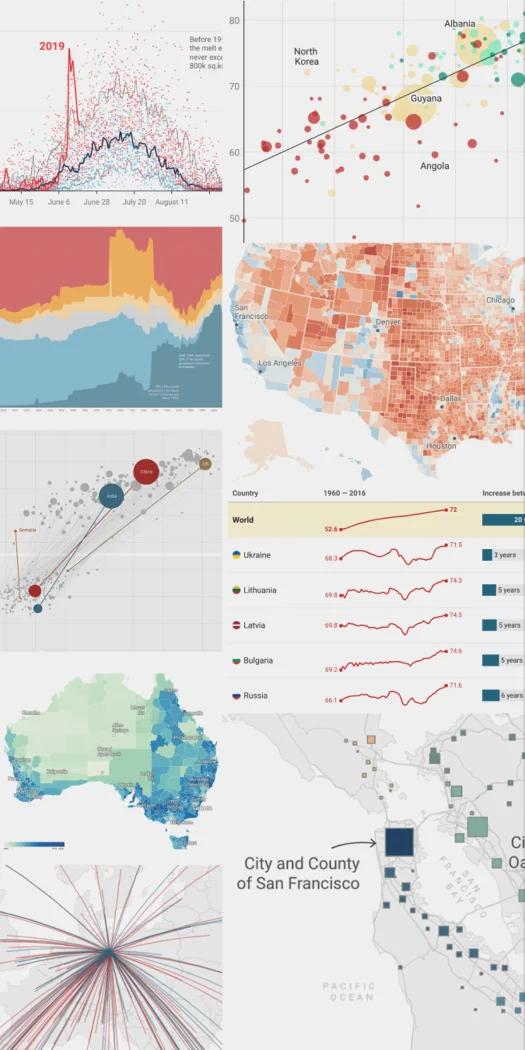
Build interactive data stories from visualization templates
Editorial discoveryFreemium

0 props
Props are a thank-you from members.
 Full size
Datawrapper helps users turn data into charts, maps and tables for web publication. Upload a small dataset, choose a chart that fits the question and verify labels, units and mobile behavior before embedding it. It suits journalists and teams that want to publish a clear visual without building a frontend for every chart. Your data and annotation choices still determine how accurately a reader understands the result. Check the current plan for team, export and branding requirements. Test an embed in the actual site where it will run and make sure the title, source note and accessible alternative work there.
Good products deserve a good conversation.
Be the first to start one.
Analytics
Build interactive data stories from visualization templates

Analytics
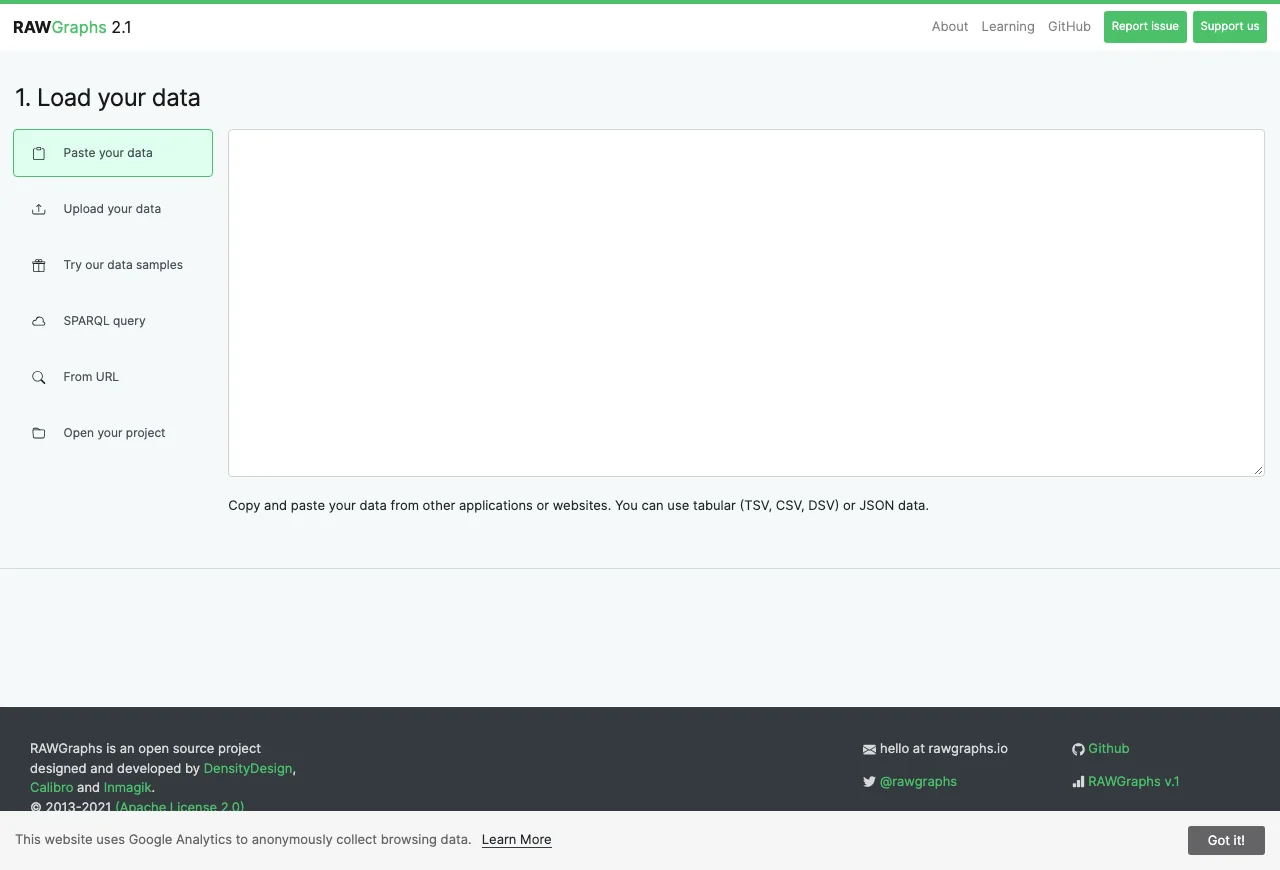
Make data visualizations and export editable graphics

Analytics
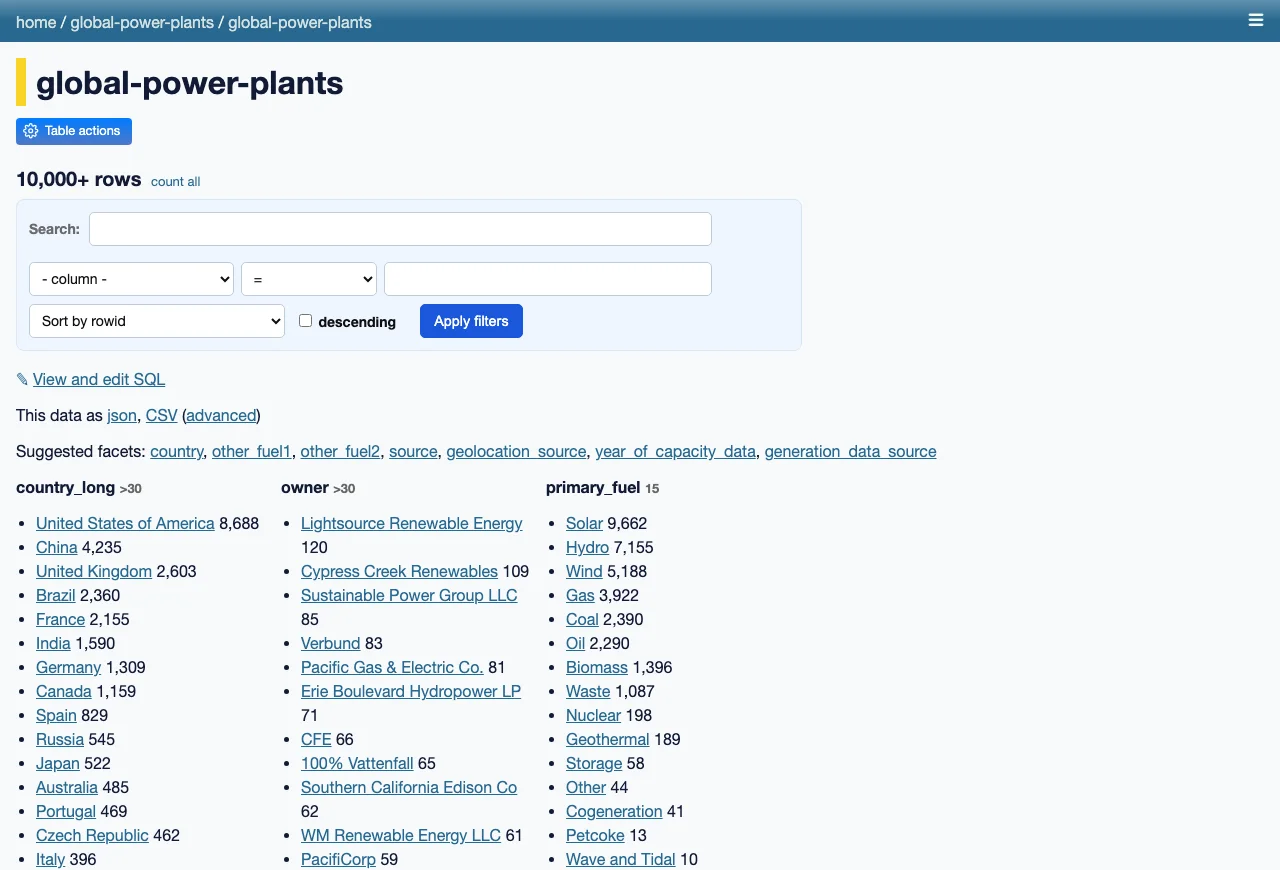
Browse and publish SQLite datasets from a web interface