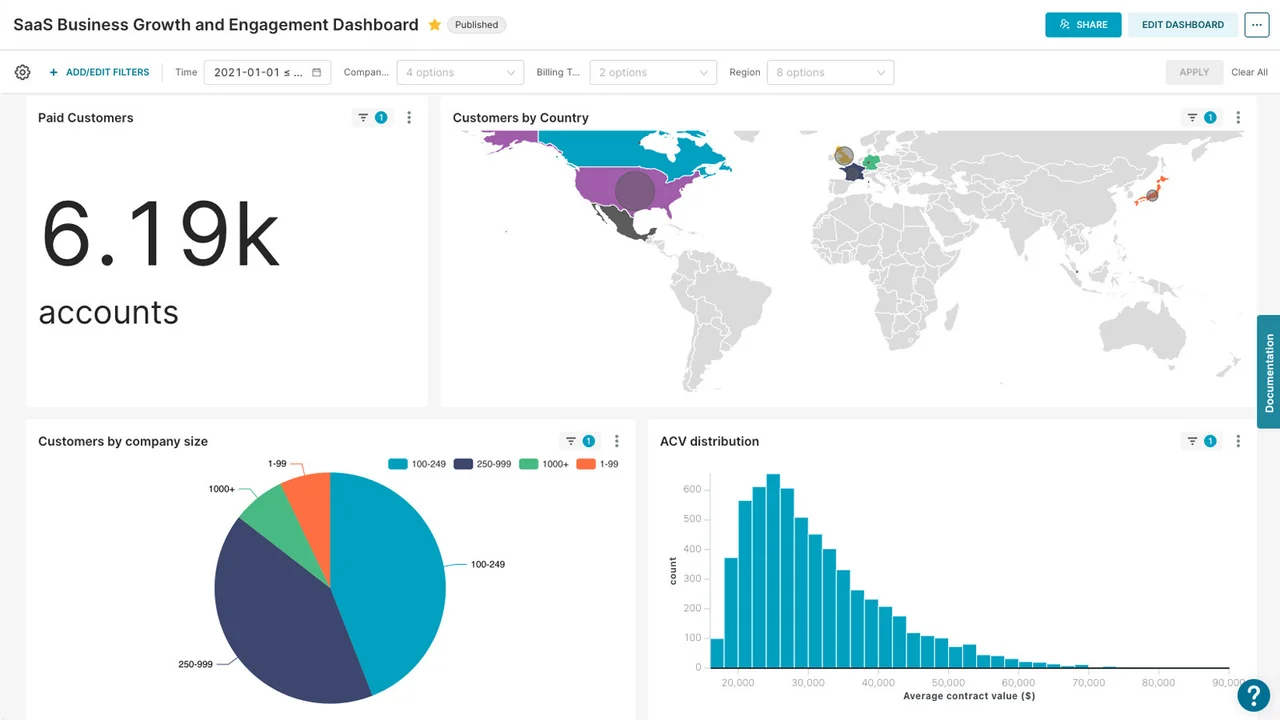

Apache Superset
Analytics
Build charts and dashboards on top of a SQL data source
Editorial discoveryOpen source

0 props
Props are a thank-you from members.
 Full size
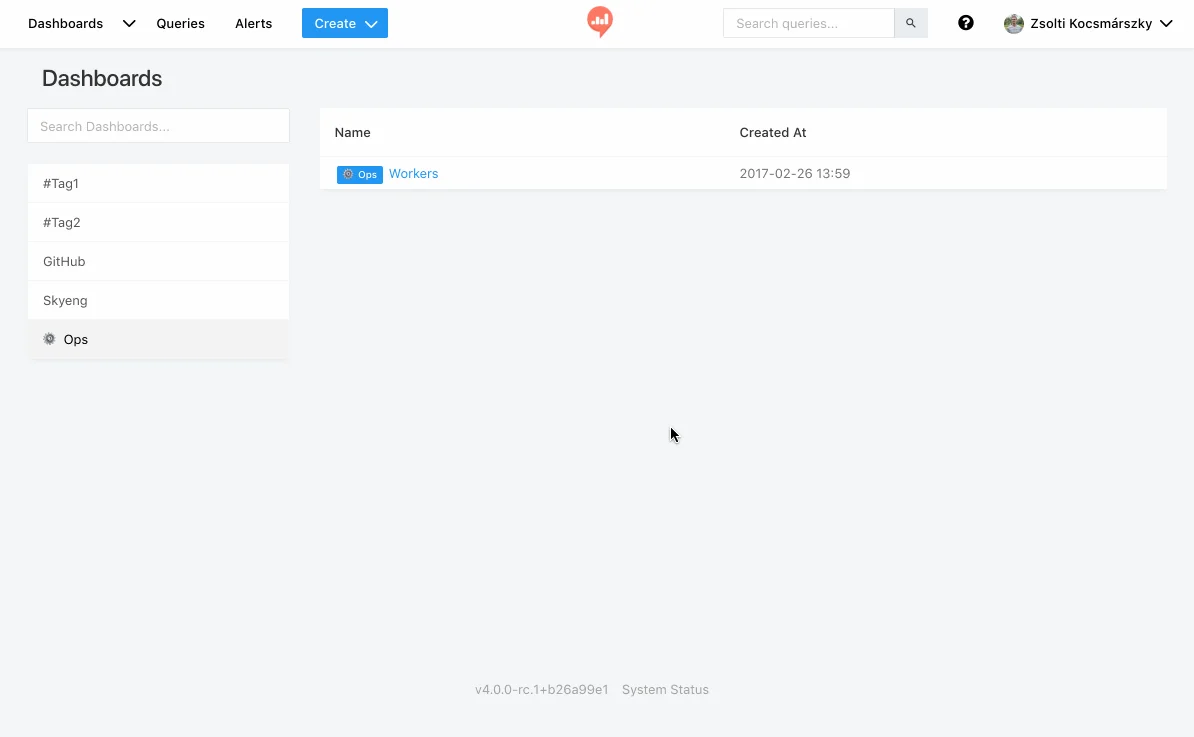
Redash lets analysts connect to supported data sources, write queries and build visualizations from the results. Save a query that answers a recurring question and add its chart to a dashboard for colleagues. Query parameters let the same report serve more than one date range or segment. The approach is useful when your team already understands SQL and needs a way to publish its analysis. A deployment still needs attention to credentials, query performance and the freshness of saved results. Check which data source and authentication options your environment requires. Start with a small dashboard and make sure every person viewing it has the access they need to the report without exposing records outside the intended audience.
Good products deserve a good conversation.
Be the first to start one.
Analytics
Build charts and dashboards on top of a SQL data source

Analytics
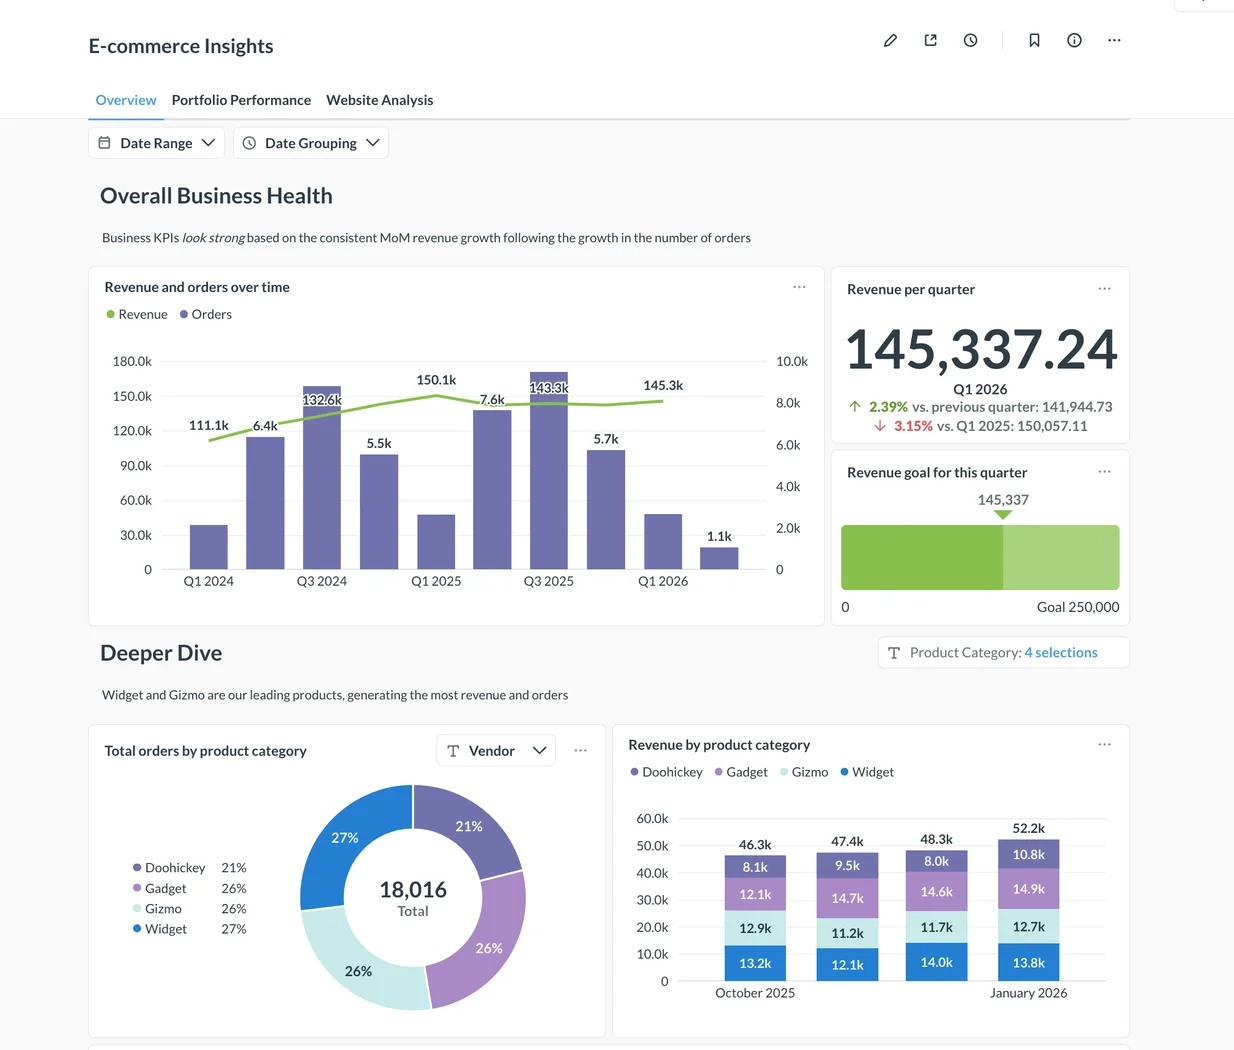
Build recurring reports around questions people ask

Analytics
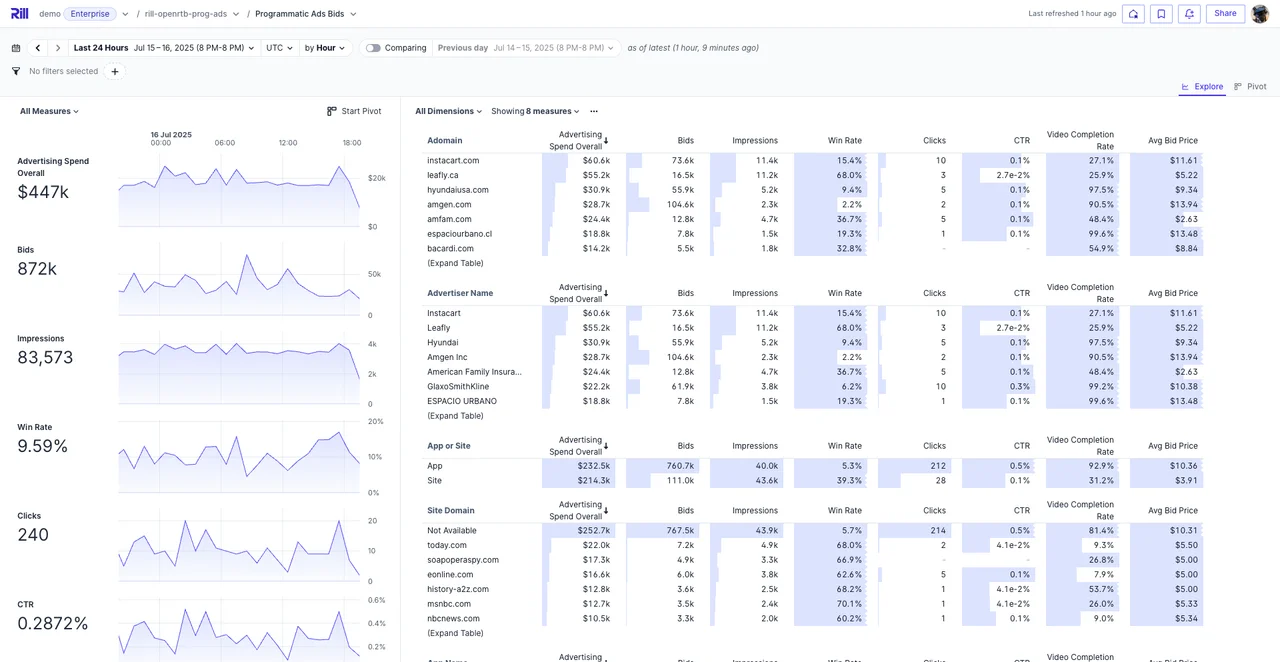
Explore high-level data and drill into dimensions from dashboards