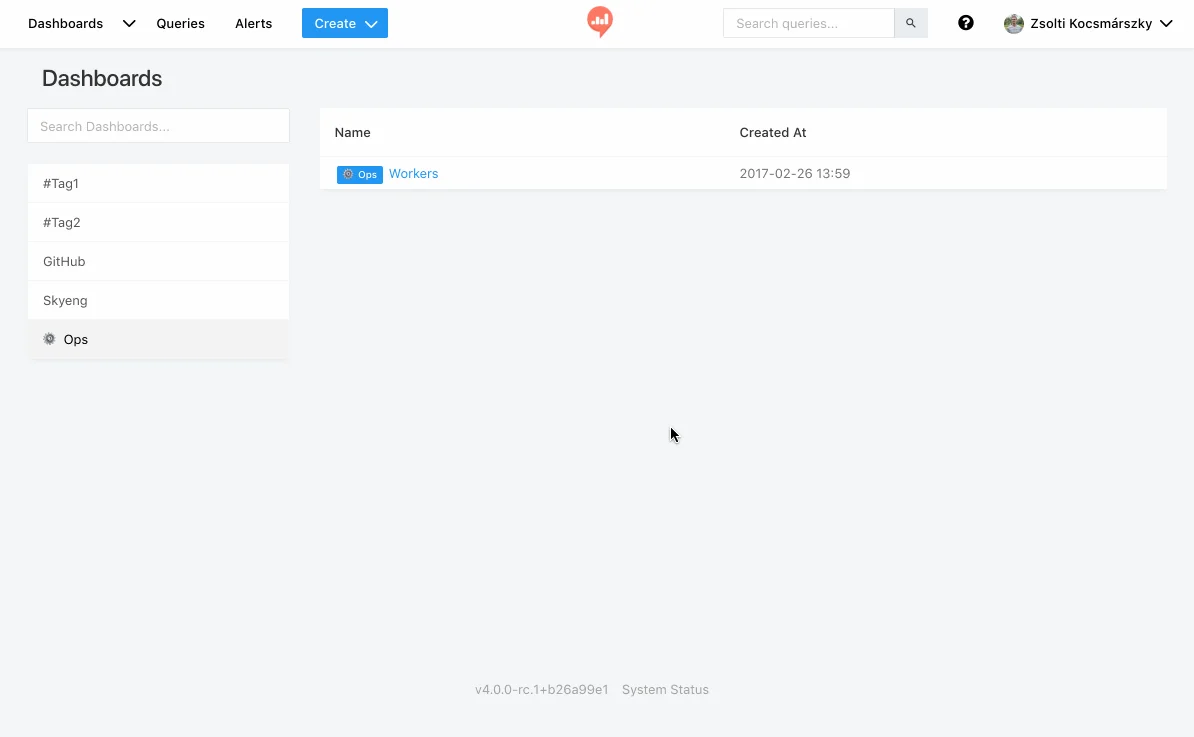

Redash
Analytics
Turn saved queries into charts and dashboards
Editorial discoveryOpen source

0 props
Props are a thank-you from members.
 Full size
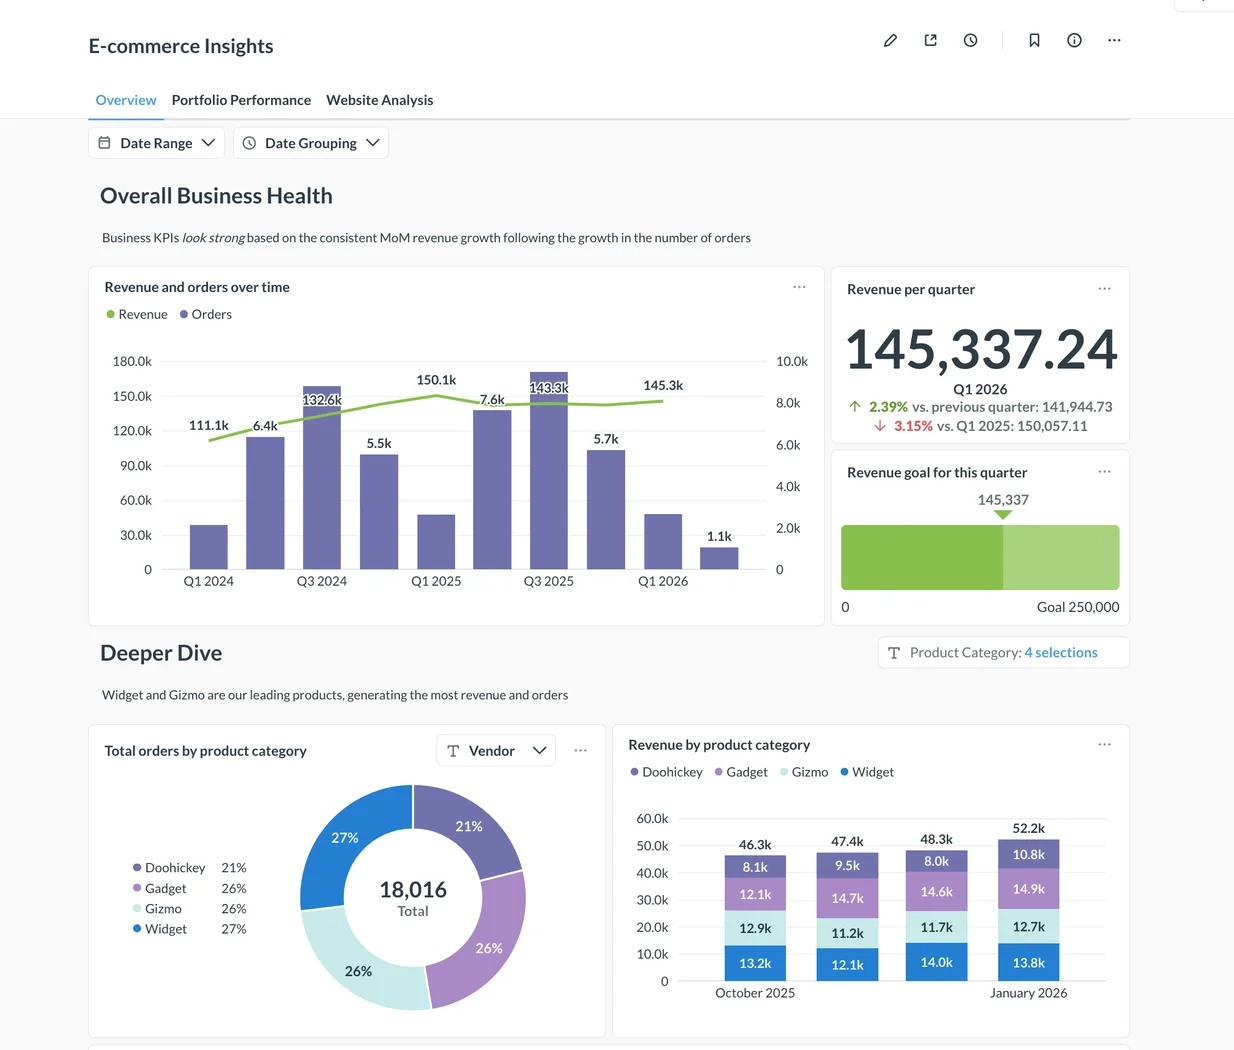
Metabase connects to databases so teams can answer questions and share dashboards. Start with a question such as which products were ordered this week, choose the relevant fields and filters, then turn the result into a chart or table. People who know SQL can write their own queries when the visual builder is too limiting. Save the useful reports in collections and build a dashboard around a recurring conversation. An open source edition is available alongside hosted and commercial offerings. Before sharing a dashboard widely, test how filters apply to its cards and who can see the underlying records. Decide who will maintain metric definitions so changes in the database do not silently change how the team interprets a report.
Good products deserve a good conversation.
Be the first to start one.
Analytics
Turn saved queries into charts and dashboards

Analytics
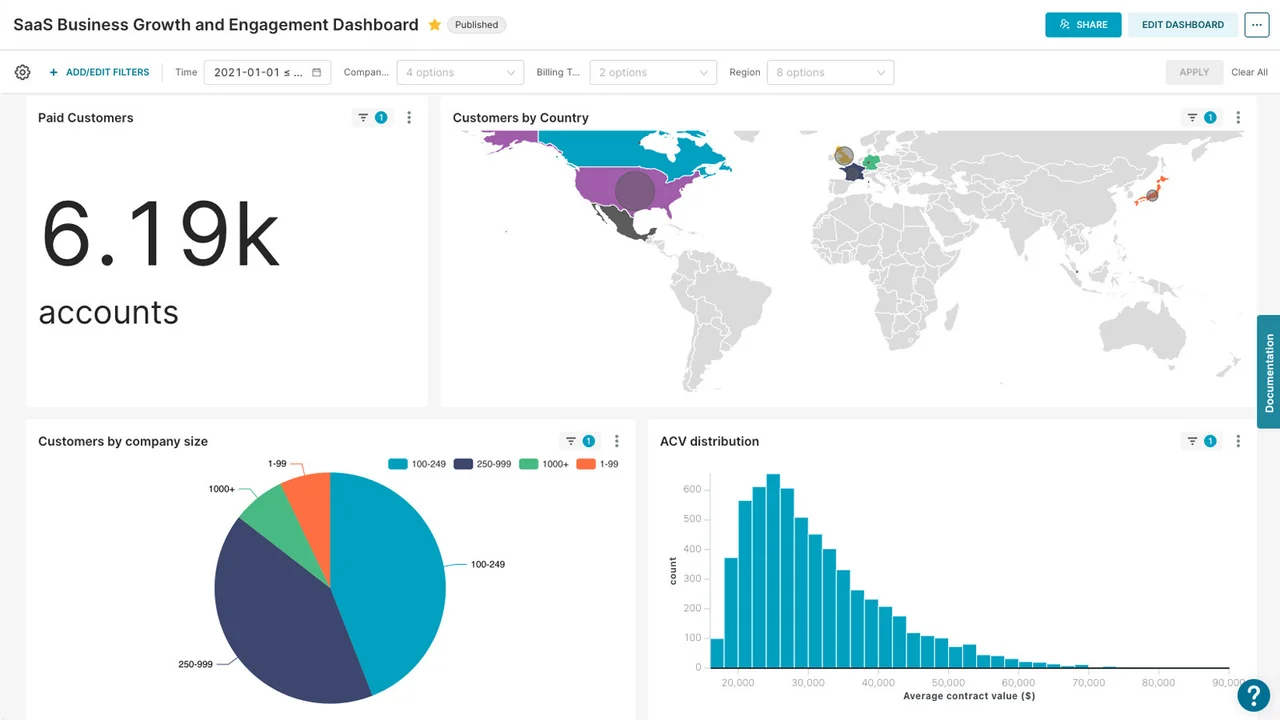
Build charts and dashboards on top of a SQL data source

Analytics
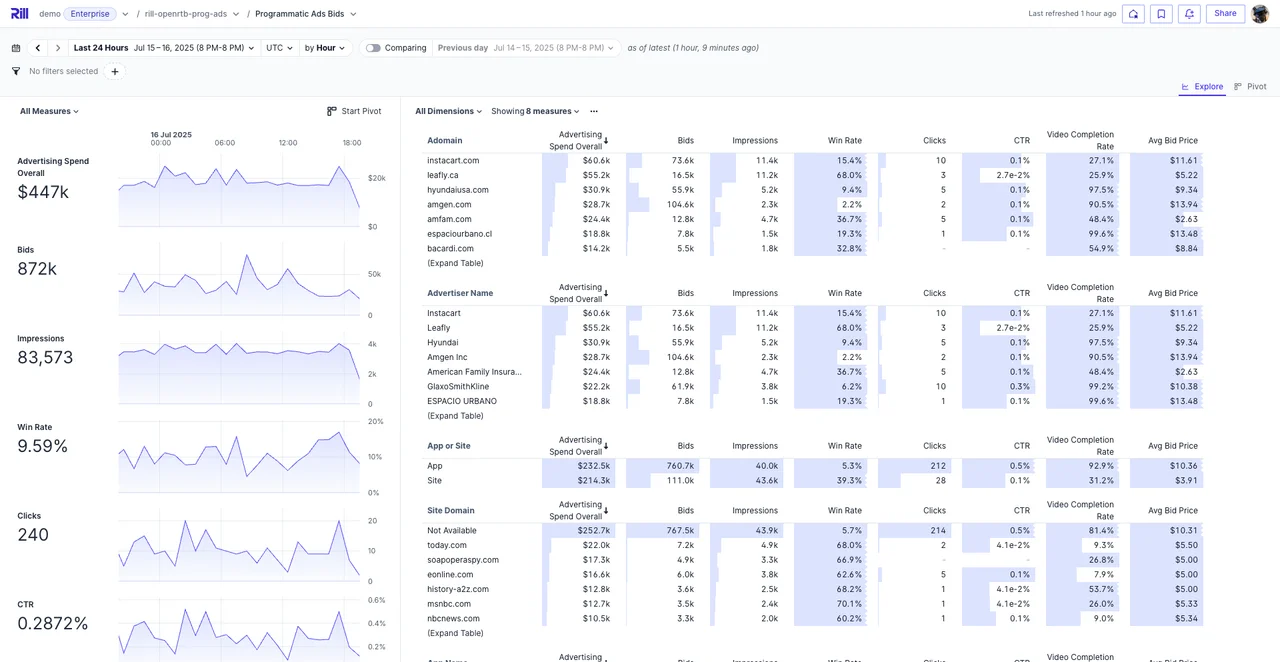
Explore high-level data and drill into dimensions from dashboards