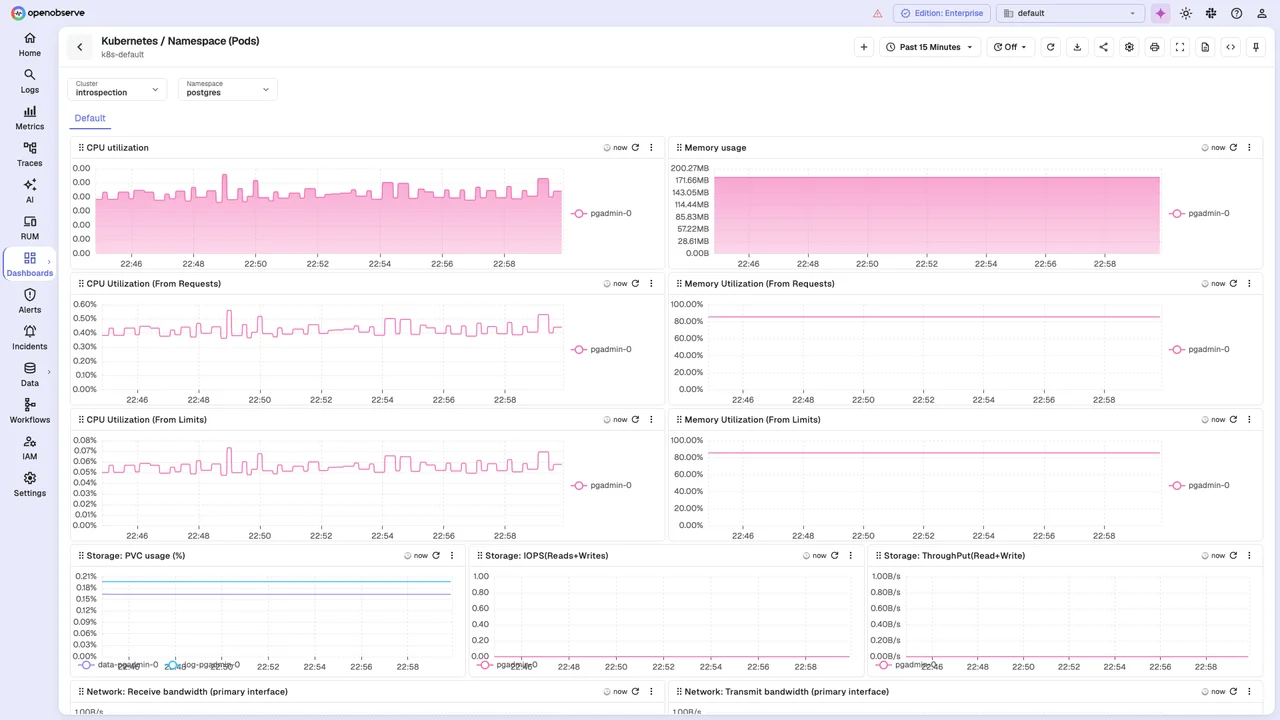

OpenObserve
Analytics
Search operational telemetry and turn queries into dashboards
Editorial discoveryOpen source

0 props
Props are a thank-you from members.
 Full size
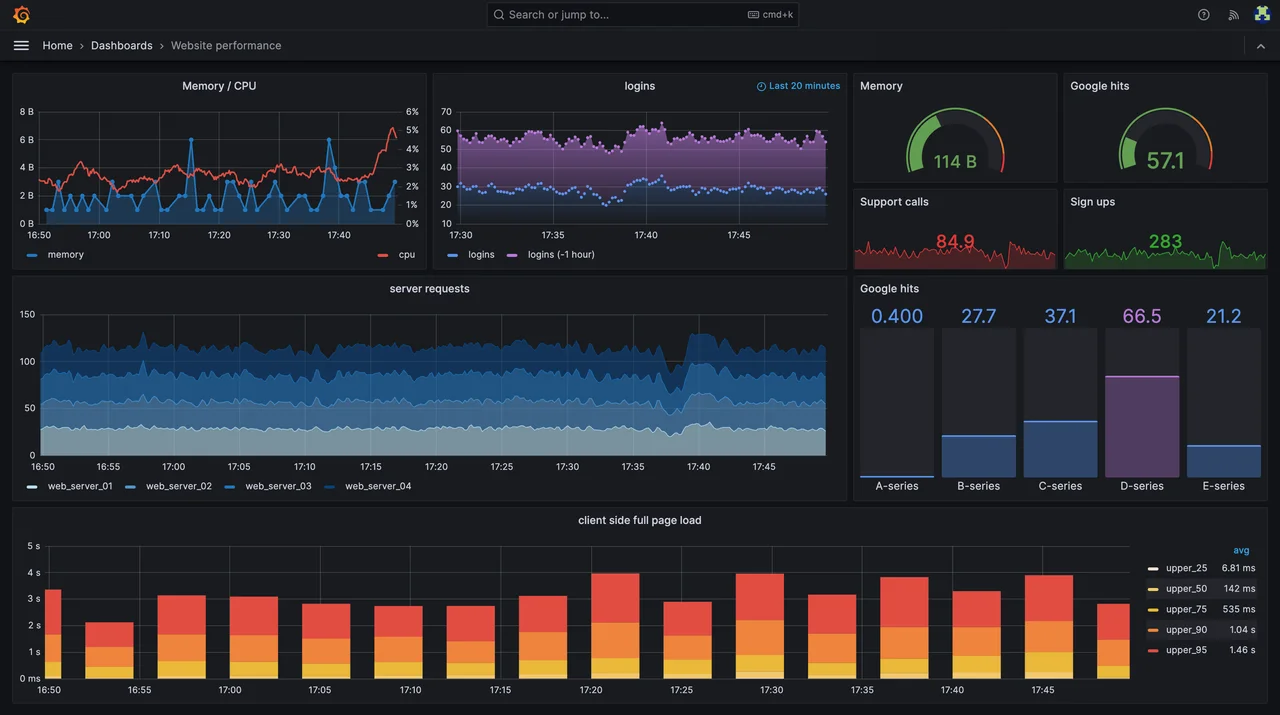
Grafana brings measurements from supported data sources into dashboards for monitoring and investigation. Connect the place where your metrics already live, choose a query and display the result in a panel. A team can put error rate, latency and resource use together so a change in one signal can be interpreted alongside the others. Dashboard variables help reuse the same view for different environments or services. Grafana has an open source edition and separately offered managed or enterprise capabilities. Plan the data source, retention, permissions and alert routing as part of the setup. Build a small dashboard from one service first and verify that the reported numbers agree with the source system.
Good products deserve a good conversation.
Be the first to start one.
Analytics
Search operational telemetry and turn queries into dashboards

Analytics
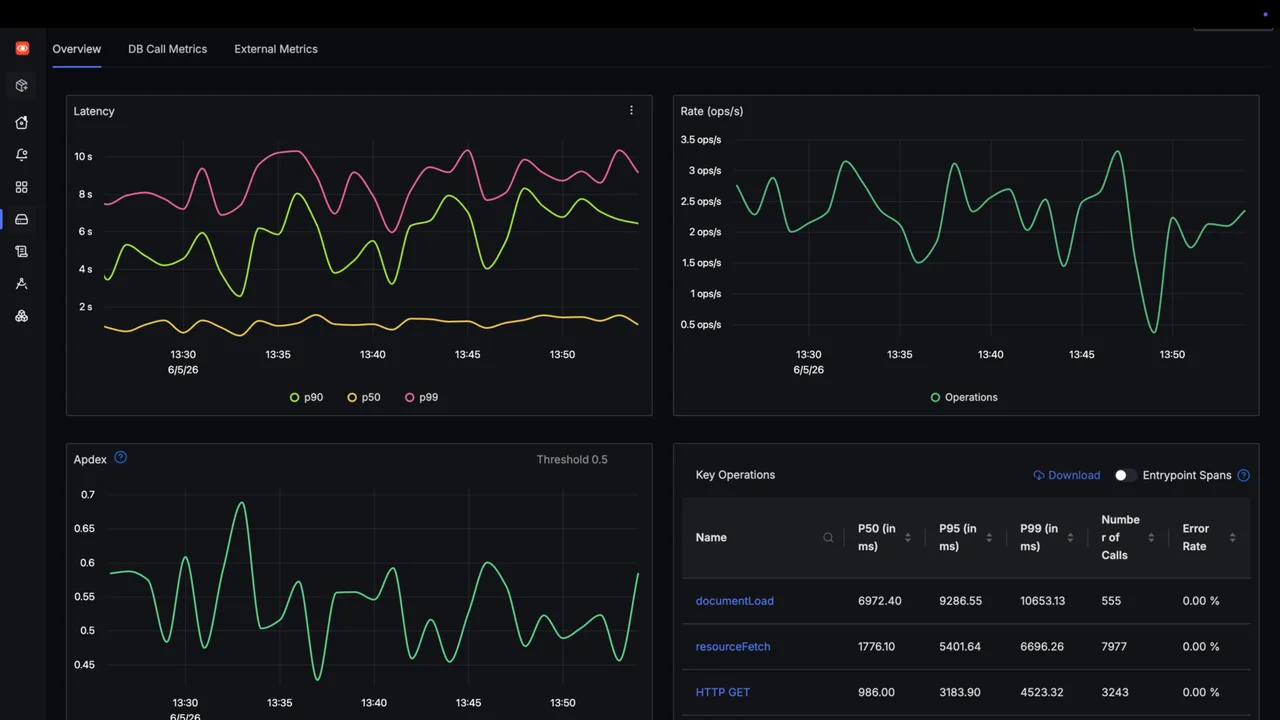
Investigate application traces, logs and metrics together

Analytics
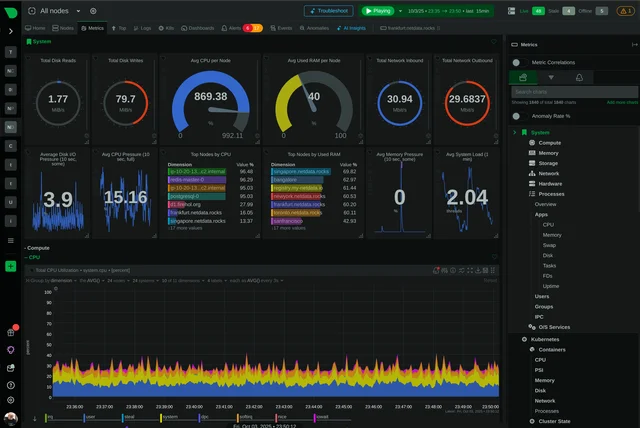
Watch infrastructure metrics as a system changes