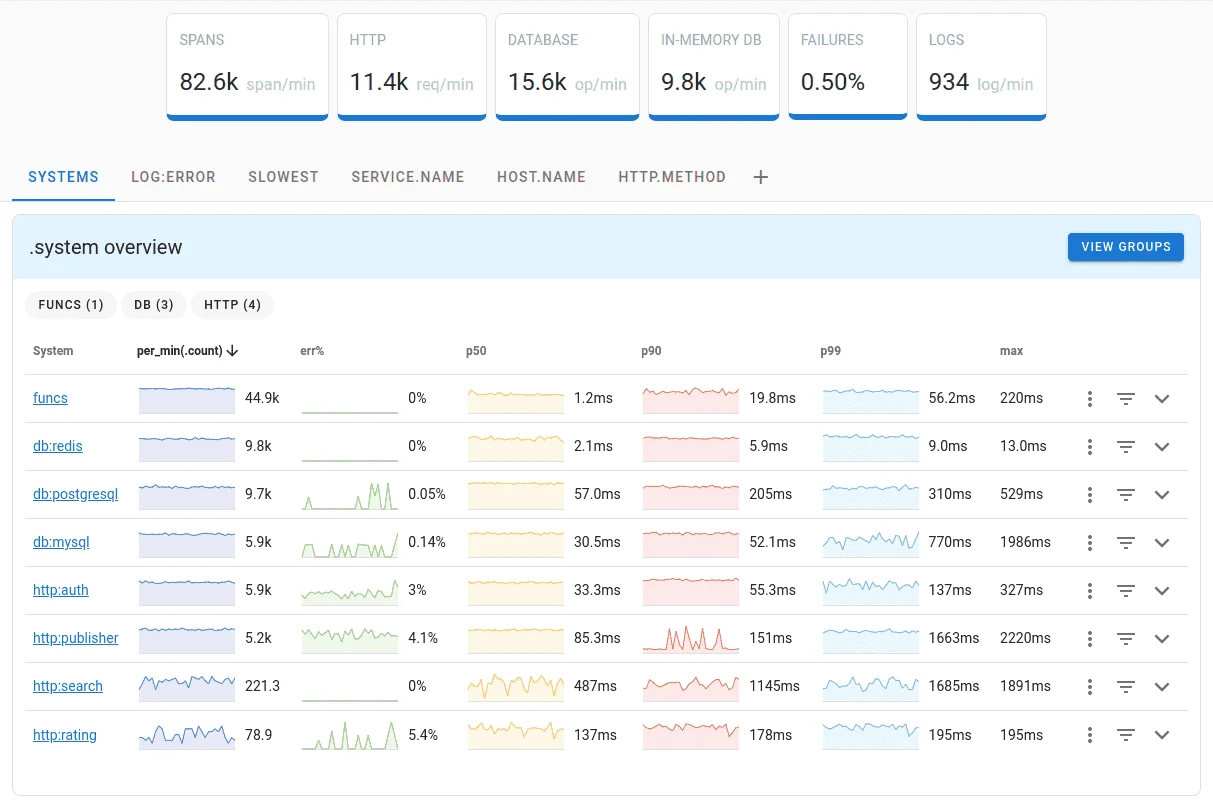

Uptrace
Analytics
Follow application requests from traces into related telemetry
Editorial discoveryOpen source

0 props
Props are a thank-you from members.
 Full size
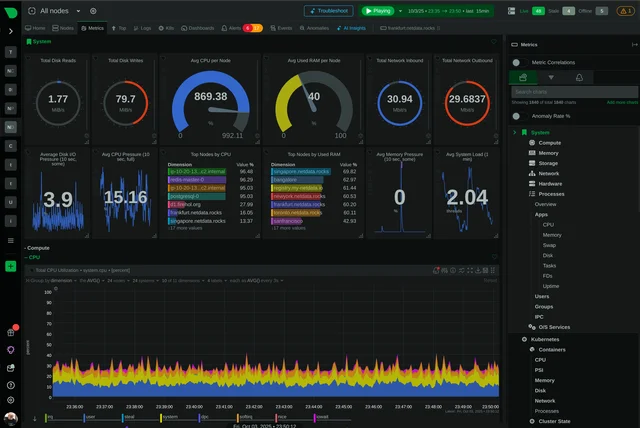
Netdata collects system and application metrics and presents real-time charts for infrastructure monitoring. Install an agent on a test machine, run a representative workload and examine CPU, memory or disk changes alongside the relevant application metrics. It helps operators investigate short-lived spikes that coarser summaries can miss. Alerts and dashboards still need attention to the scale and roles of the machines being monitored. Review which collectors and deployment modes support your environment and decide how long you need to retain observations. On a multi-host setup, compare local and central access before relying on the system for incident response.
Good products deserve a good conversation.
Be the first to start one.
Analytics
Follow application requests from traces into related telemetry


Analytics
Explore dbt-defined metrics in a reporting workspace

Analytics
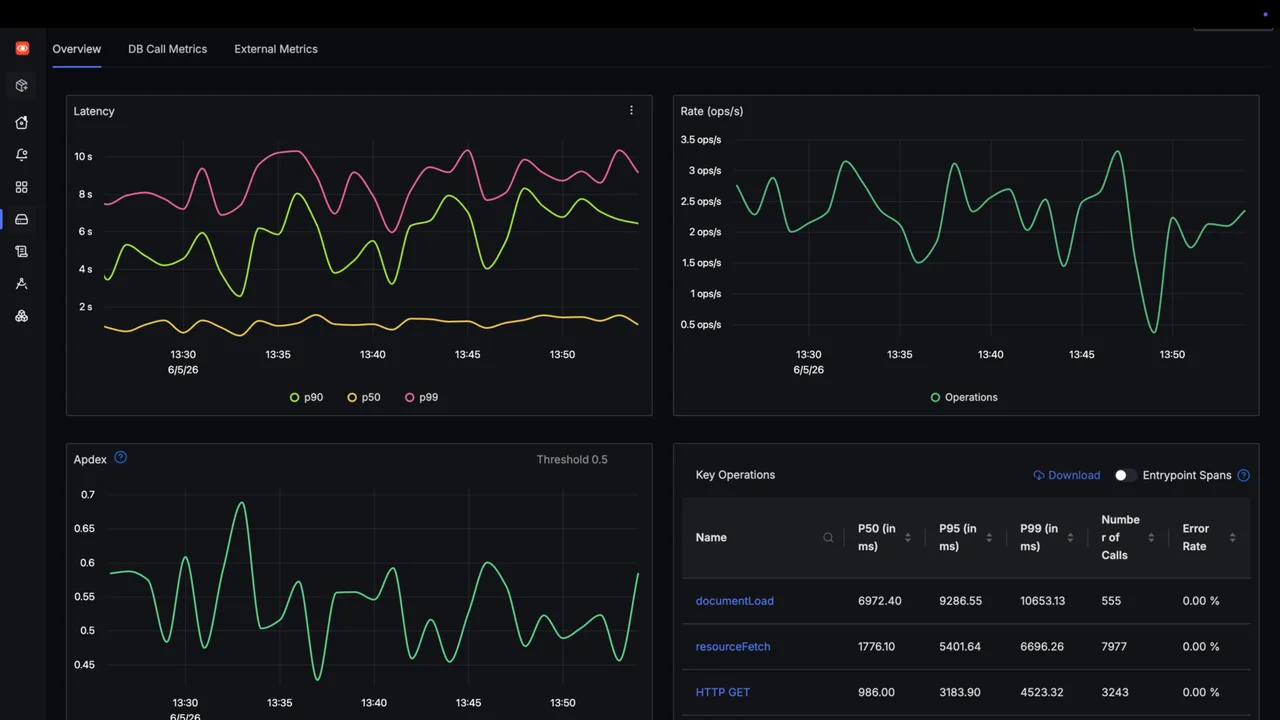
Investigate application traces, logs and metrics together