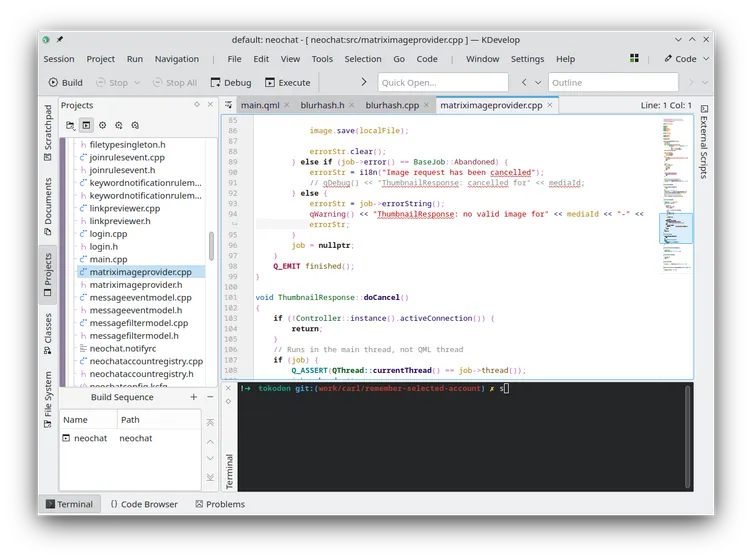

KDevelop
Developer tools
Develop, navigate, and debug source projects in a KDE IDE
Editorial discoveryOpen source

0 props
Be the first to give Props.
 Full size
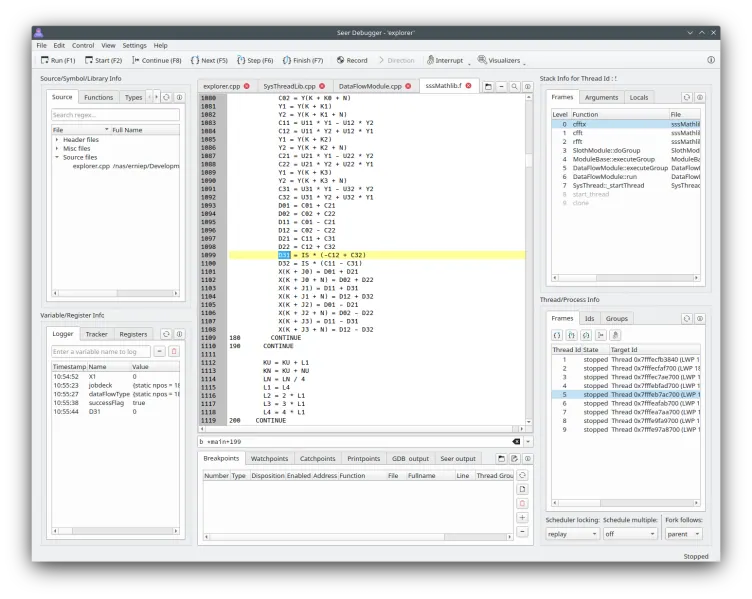
seer gives developers a graphical interface for the GDB debugger. Browse source code, add breakpoints, and inspect a paused program while stepping through its execution. The layout helps connect an observed value or state to the line of code that produced it. It is useful when you already build a program for debugging and want source, controls, and program state visible in one workspace. The app depends on a compatible GDB setup and the information present in your build.
Good products deserve a good conversation.
Be the first to start one.
Developer tools
Develop, navigate, and debug source projects in a KDE IDE

Developer tools
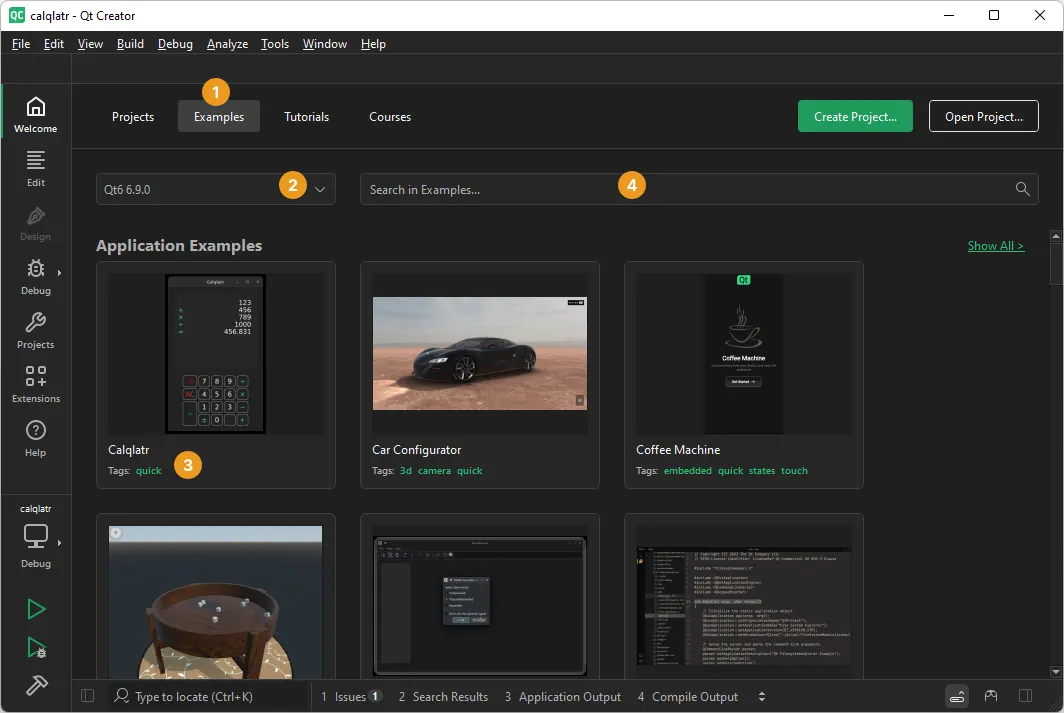
Build and debug cross-platform applications with Qt Creator

Developer tools
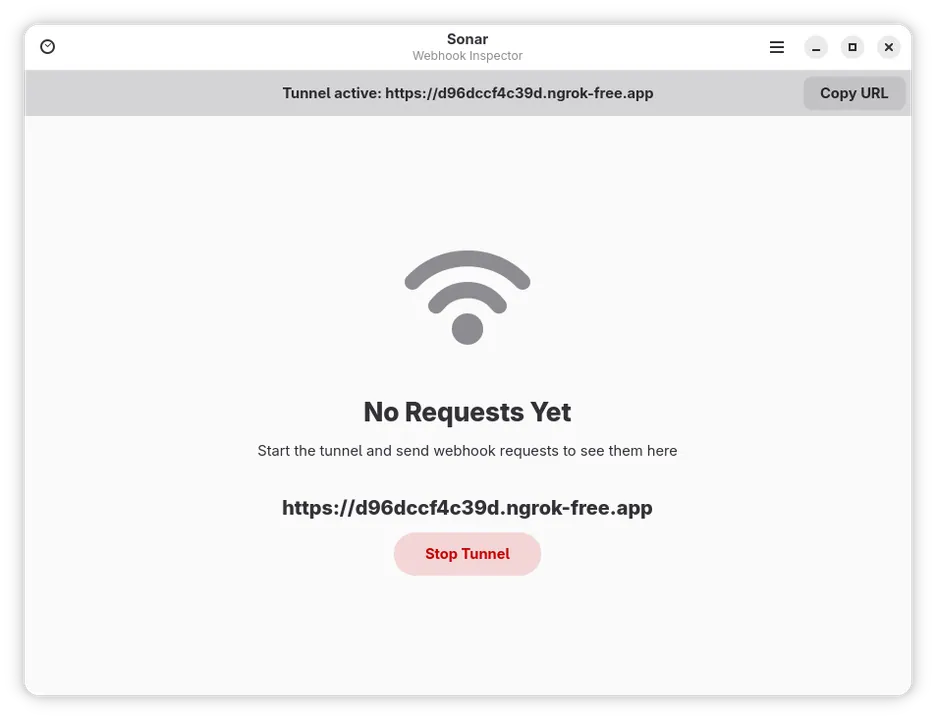
Inspect incoming webhook headers, parameters, and payloads