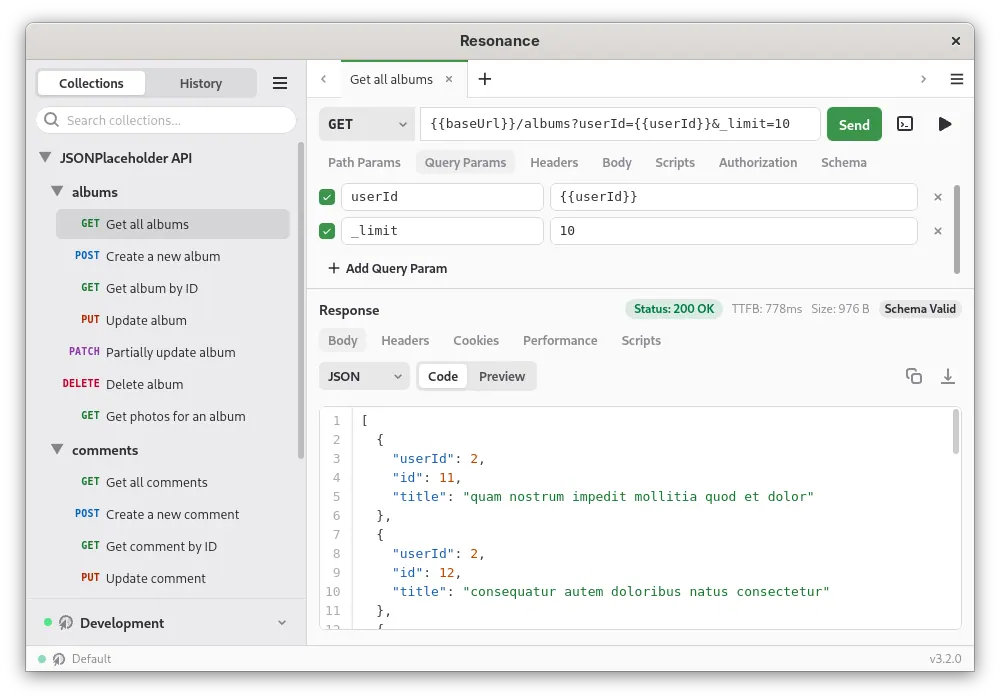

Resonance
Developer tools
Test HTTP, GraphQL, and gRPC APIs from the desktop
Editorial discoveryOpen source

Generate chart images for reports, emails and other static surfaces
Ver en español0 props
Be the first to give Props.
 Full size
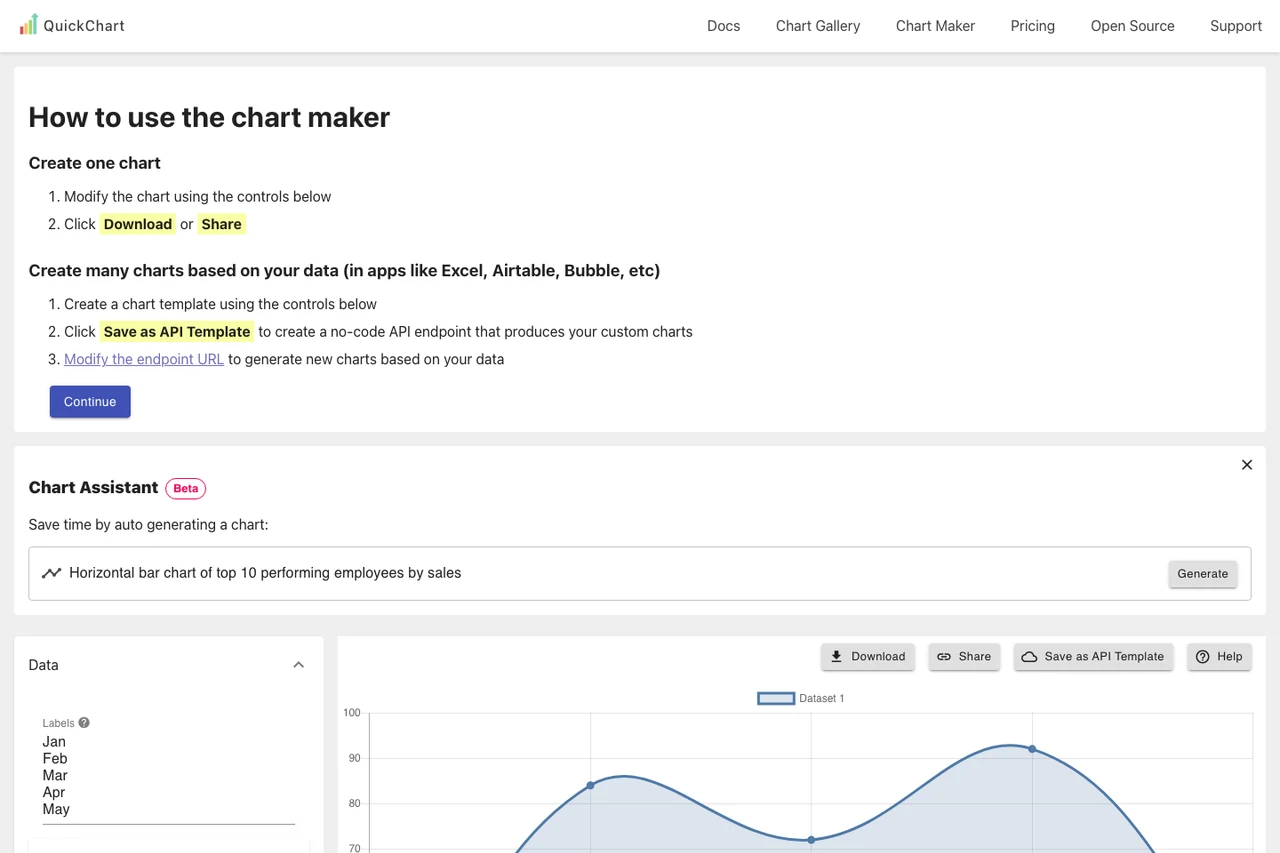
QuickChart renders charts from configuration and data, giving you an image you can put into email, a report or another surface without a live chart library. It includes a browser chart maker for testing options before building an integration. Try a small example with fixed sample data, then check text readability at the destination size. Confirm how you will handle long configurations and any sensitive values you would send to an endpoint. The hosted service and self-hosted project give you different ways to run the rendering step.
Good products deserve a good conversation.
Be the first to start one.
Developer tools
Test HTTP, GraphQL, and gRPC APIs from the desktop

Developer tools
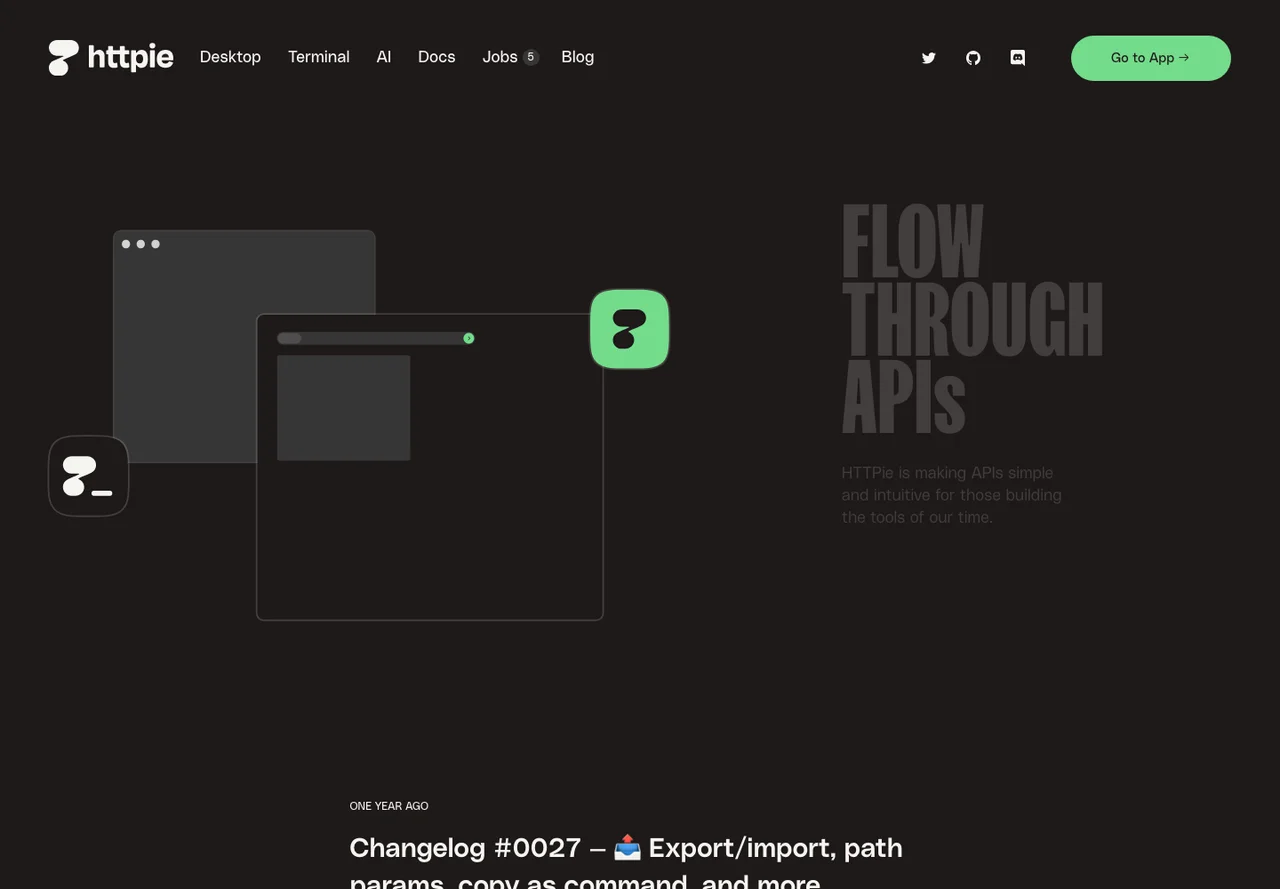
Make API requests from your terminal or desktop

Developer tools
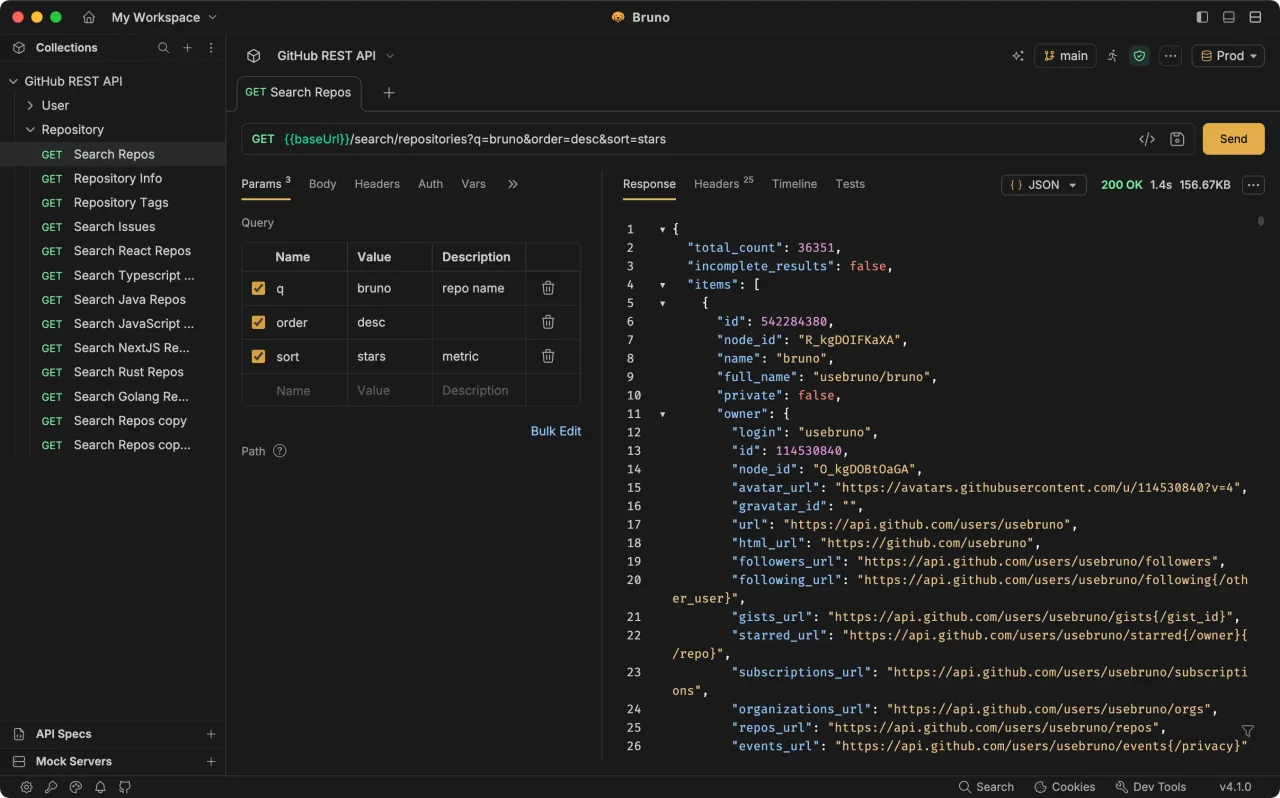
Keep API collections alongside your code