
GNU Octave
Analytics
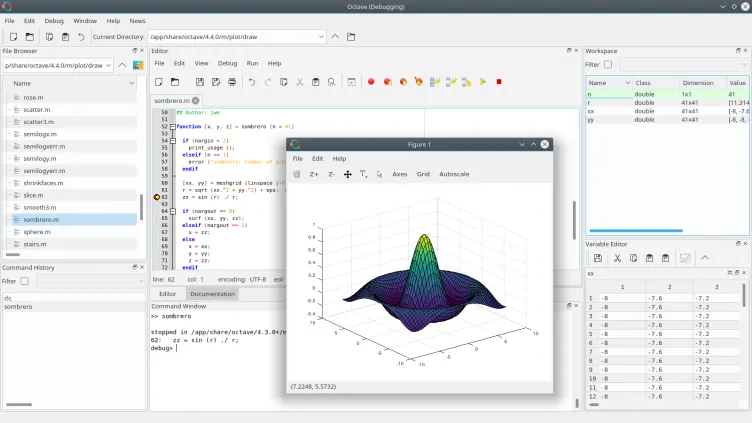
Compute and visualize numerical results with GNU Octave
Editorial discoveryOpen source
0 props
Be the first to give Props.
 Full size
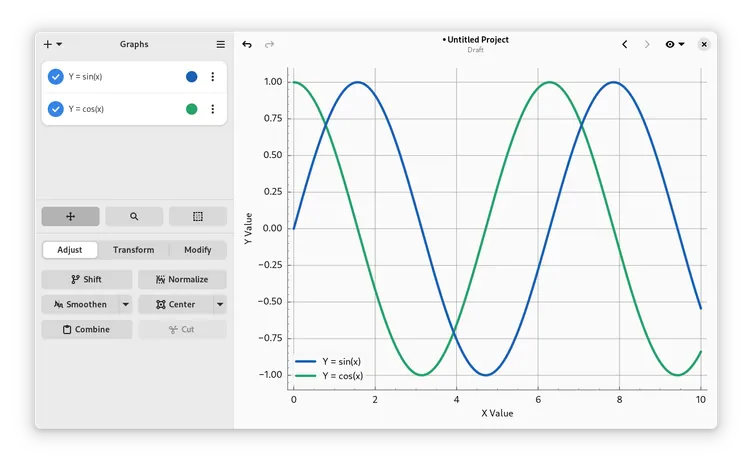
GNOME Graphs turns imported data or equations into plots you can inspect and edit on a desktop. Select and trim points, shift or scale values, smooth a series, and apply your own transformations as needed. A practical example is comparing two measured curves after moving one series onto the same reference scale. The interface helps with exploratory plotting when you want to see how a processing step affects the resulting chart while leaving the source data available.
Good products deserve a good conversation.
Be the first to start one.
Analytics
Compute and visualize numerical results with GNU Octave
Analytics
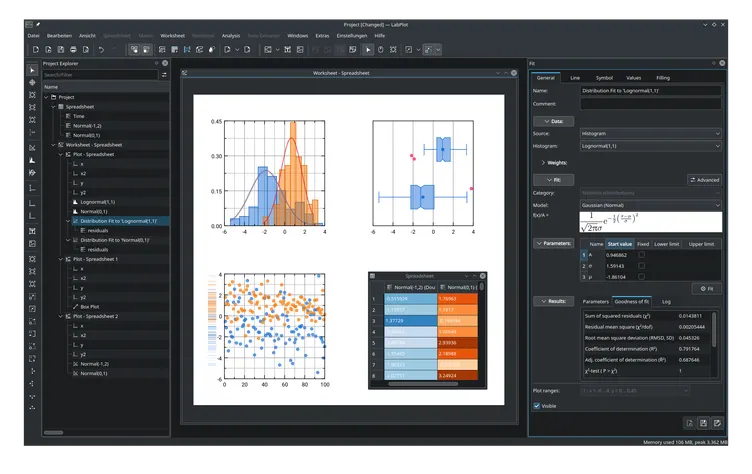
Create scientific plots and explore datasets across platforms

Analytics
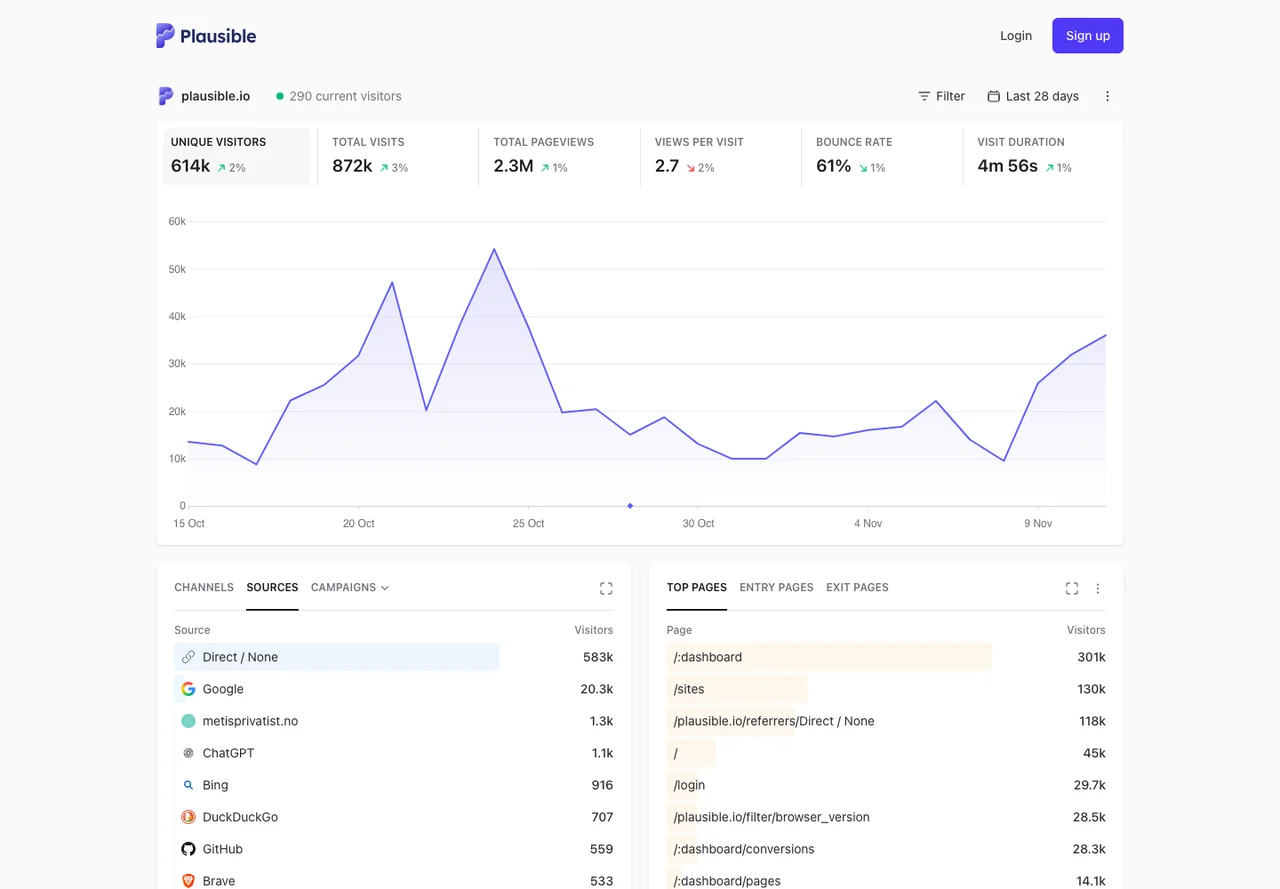
Privacy-friendly website analytics with goals and referrer reports