
Evidence
Analytics
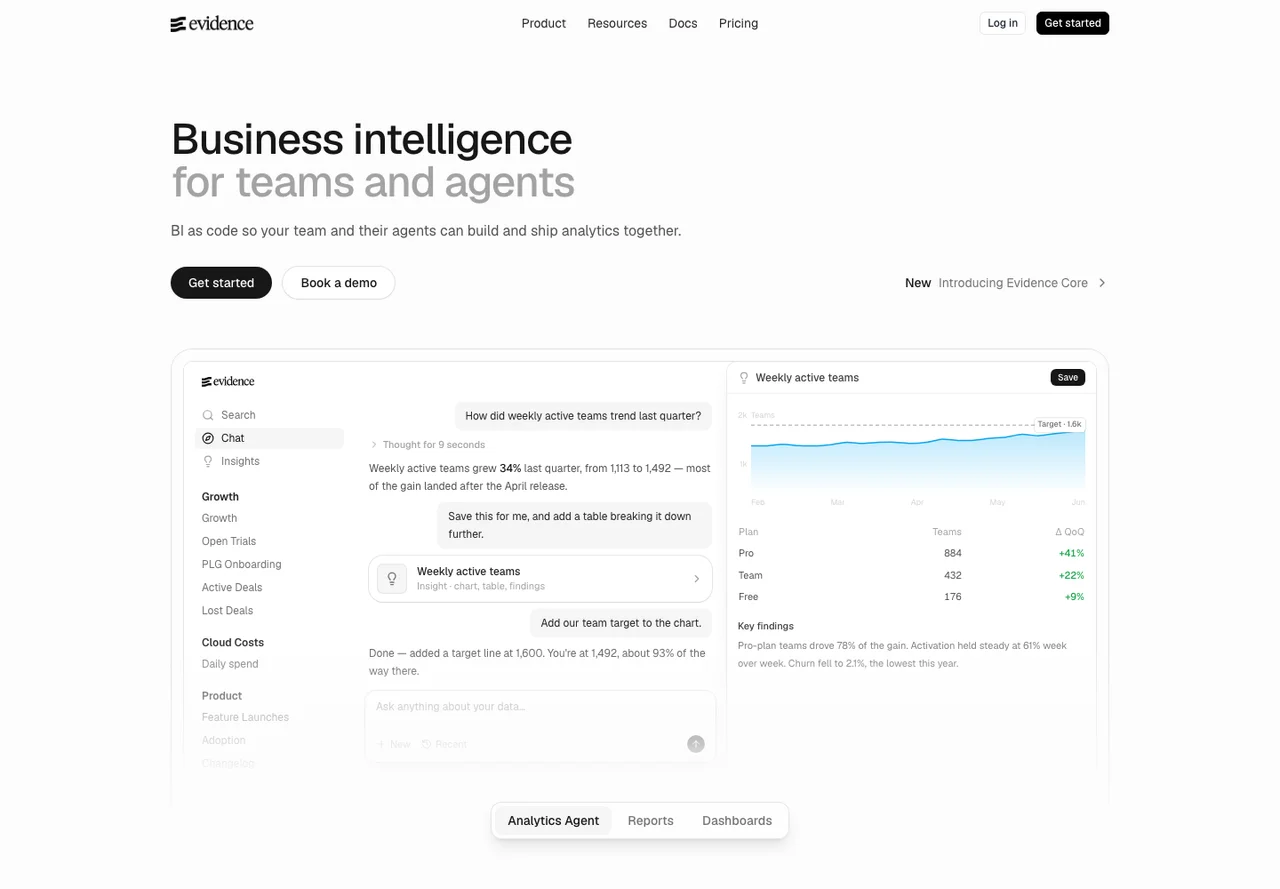
Write data reports with SQL queries and versioned Markdown
Editorial discoveryOpen source

0 props
Props are a thank-you from members.
 Full size
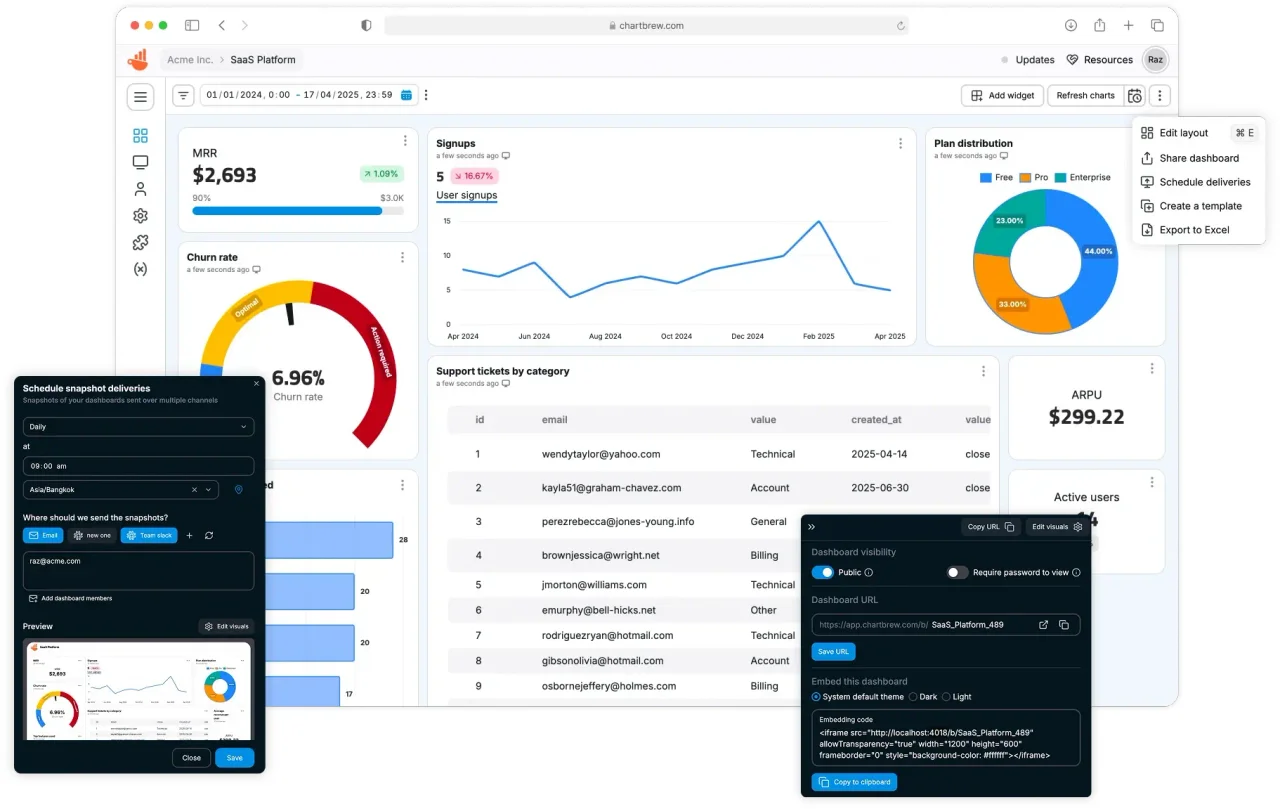
Chartbrew helps teams build dashboards from connected data sources. Start with a reporting question, connect a sample source, create a query or data request, and select a chart that makes the result understandable. Combine several charts when they describe the same operation, such as transaction totals and daily error rates. The project can be self-hosted, with a managed option available for teams that prefer a service. It is a reporting layer, so you still need to decide what each metric means and make sure the underlying data is accurate. Check which connector, refresh behavior and sharing settings your use case needs before exposing any dashboard.
Good products deserve a good conversation.
Be the first to start one.
Analytics
Write data reports with SQL queries and versioned Markdown

Analytics
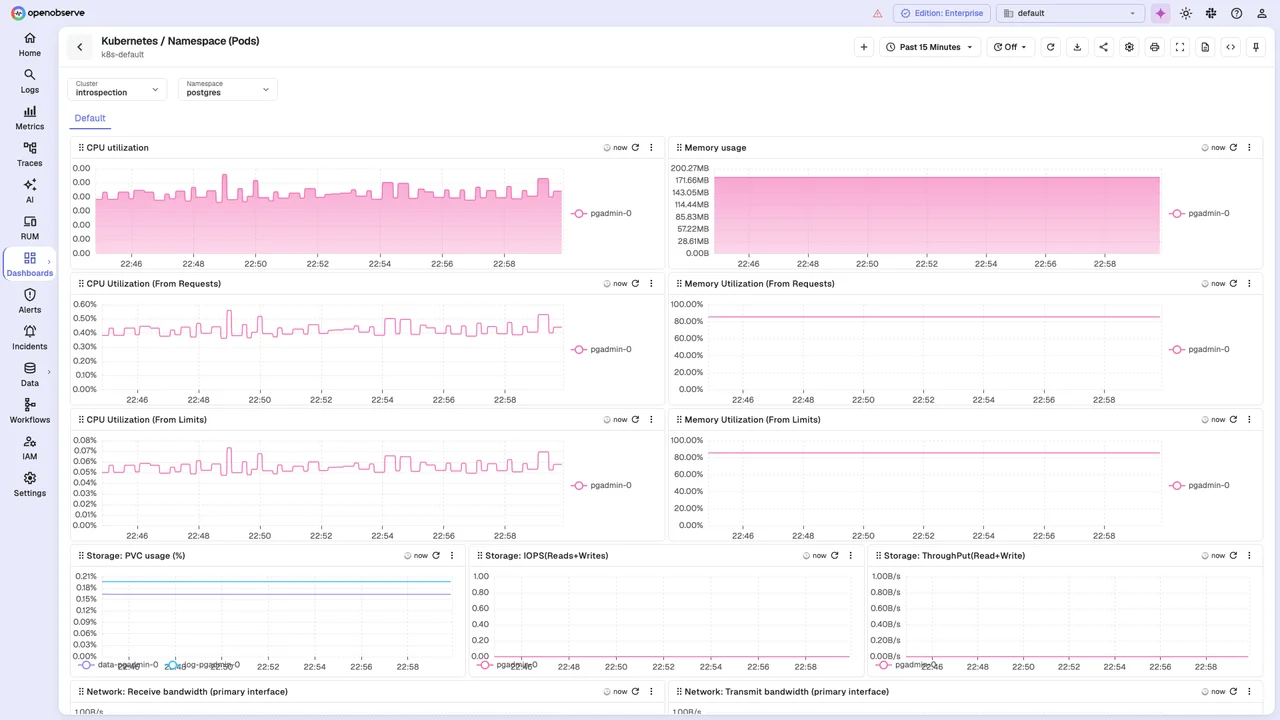
Search operational telemetry and turn queries into dashboards

Analytics
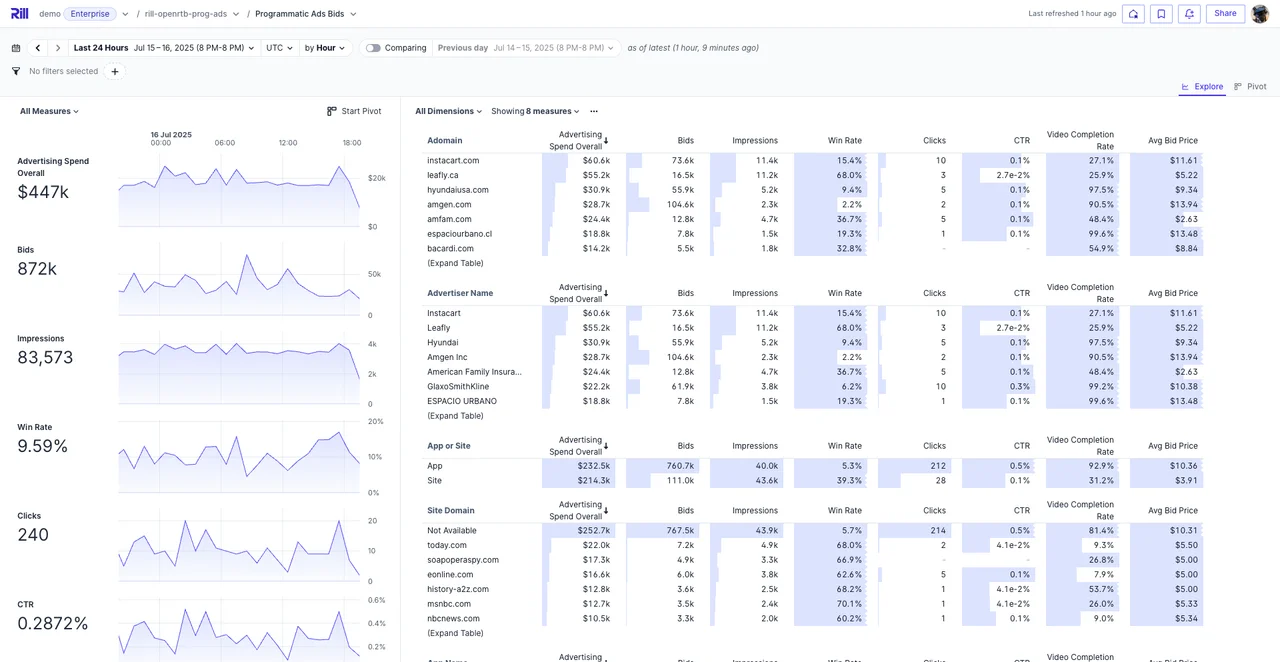
Explore high-level data and drill into dimensions from dashboards