
Yutovo
Learning
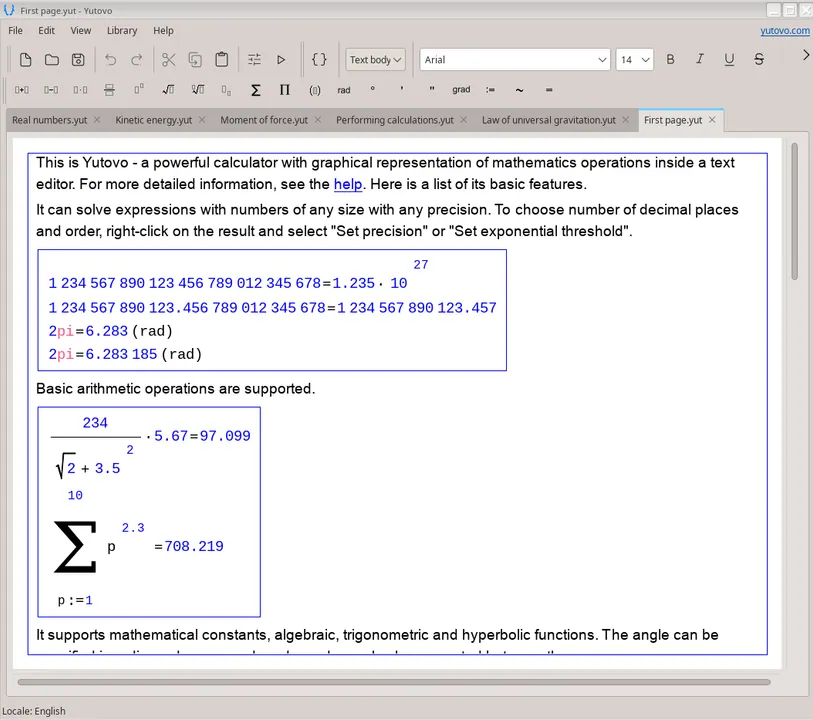
Write and evaluate calculations on a visual math page
Editorial discoveryOpen source

0 props
Be the first to give Props.
 Full size
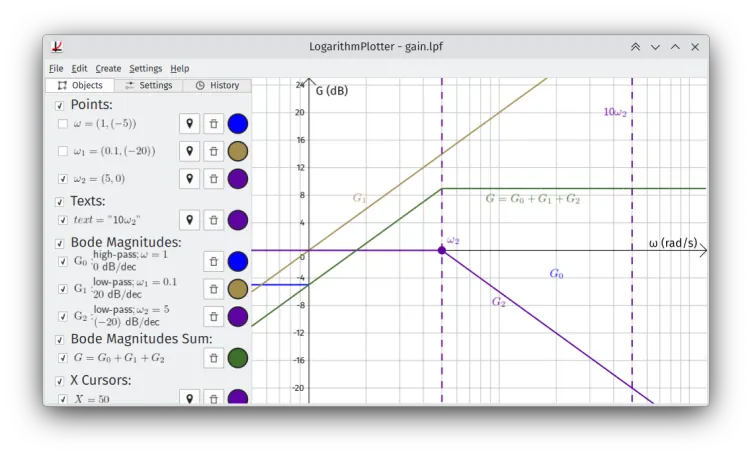
LogarithmPlotter helps students and electronics instructors prepare logarithmic charts, particularly the straight-line approximations used in Bode plots. Its object-based model lets you adjust the components of a graph after placing them, instead of redrawing a diagram by hand when a value changes. You can switch to linear scales for related exercises. It is well suited to making teaching figures that illustrate how a cutoff frequency or a gain change shifts a response before students work through the full calculation.
Good products deserve a good conversation.
Be the first to start one.
Learning
Write and evaluate calculations on a visual math page

Learning
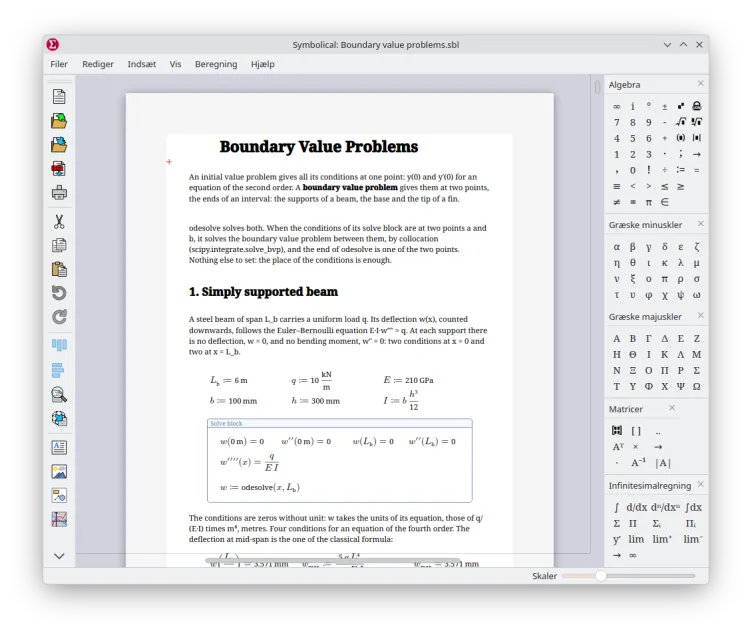
Write math documents that include equations and evaluated results

Learning
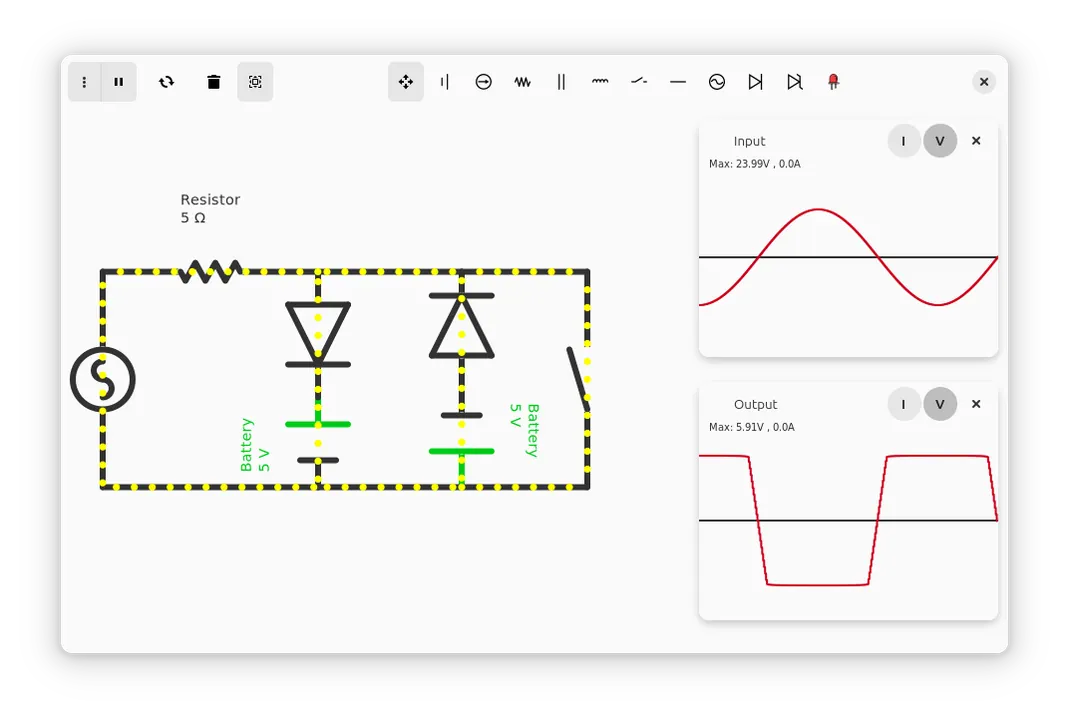
Build simple circuits and plot current and voltage