
yEd Graph Editor
Design
Draw graphs and let automatic layouts arrange their connections
Editorial discoveryFree
0 props
Props are a thank-you from members.
 Full size
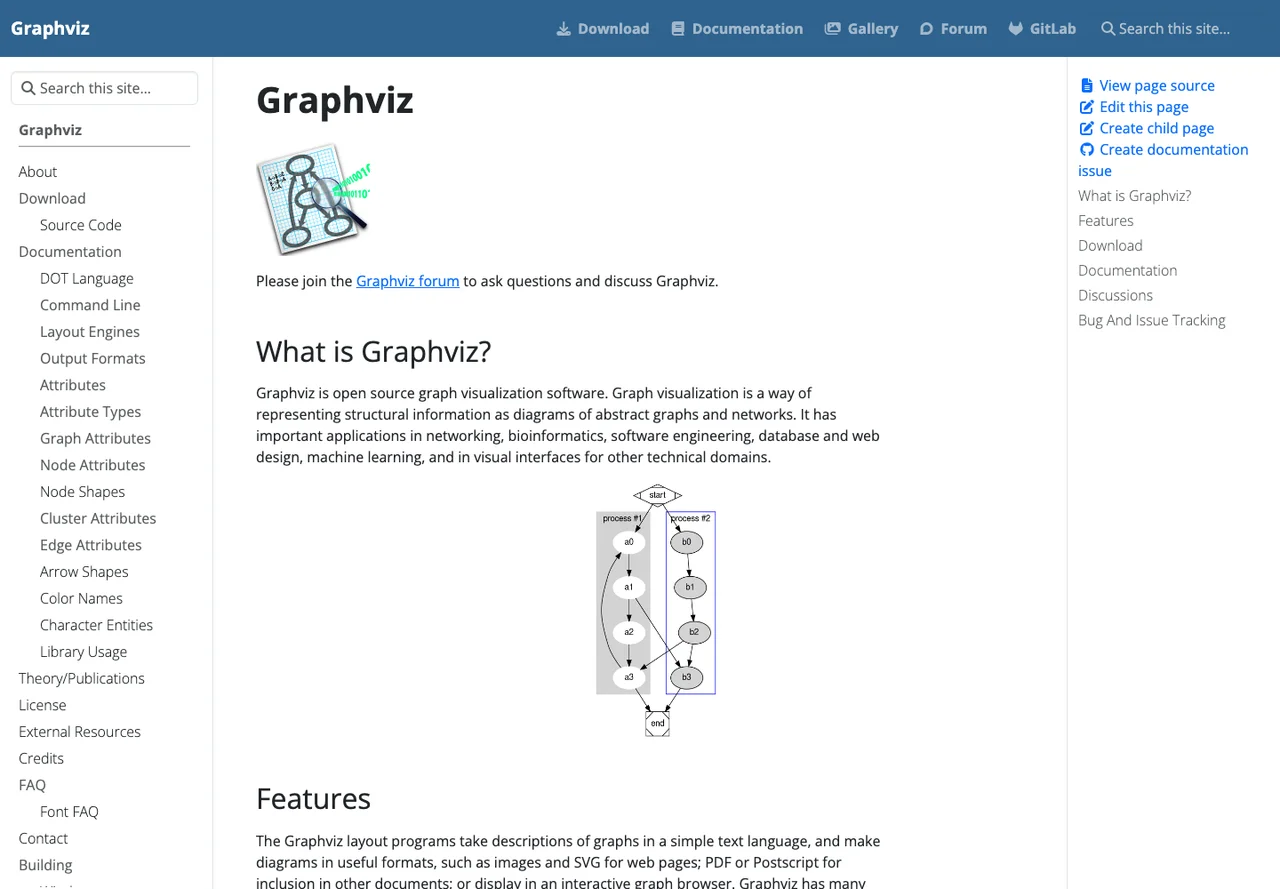
Graphviz renders graphs described with nodes, edges and attributes, typically in the DOT language. Start by drawing a small dependency graph and try a layout that matches the kind of relationships you want readers to see. It fits technical diagrams generated from data or checked into a repository, where hand-positioning each node would be slow. Automatic layouts still need useful labels and decisions about what to include. Check which output format works in your documentation or presentation. If the graph becomes hard to read at realistic size, group elements or generate several diagrams around specific questions.
Good products deserve a good conversation.
Be the first to start one.
Design
Draw graphs and let automatic layouts arrange their connections

Design
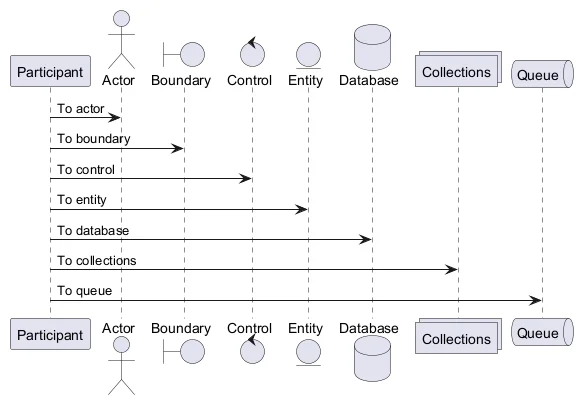
Describe UML and other technical diagrams as editable text

Design
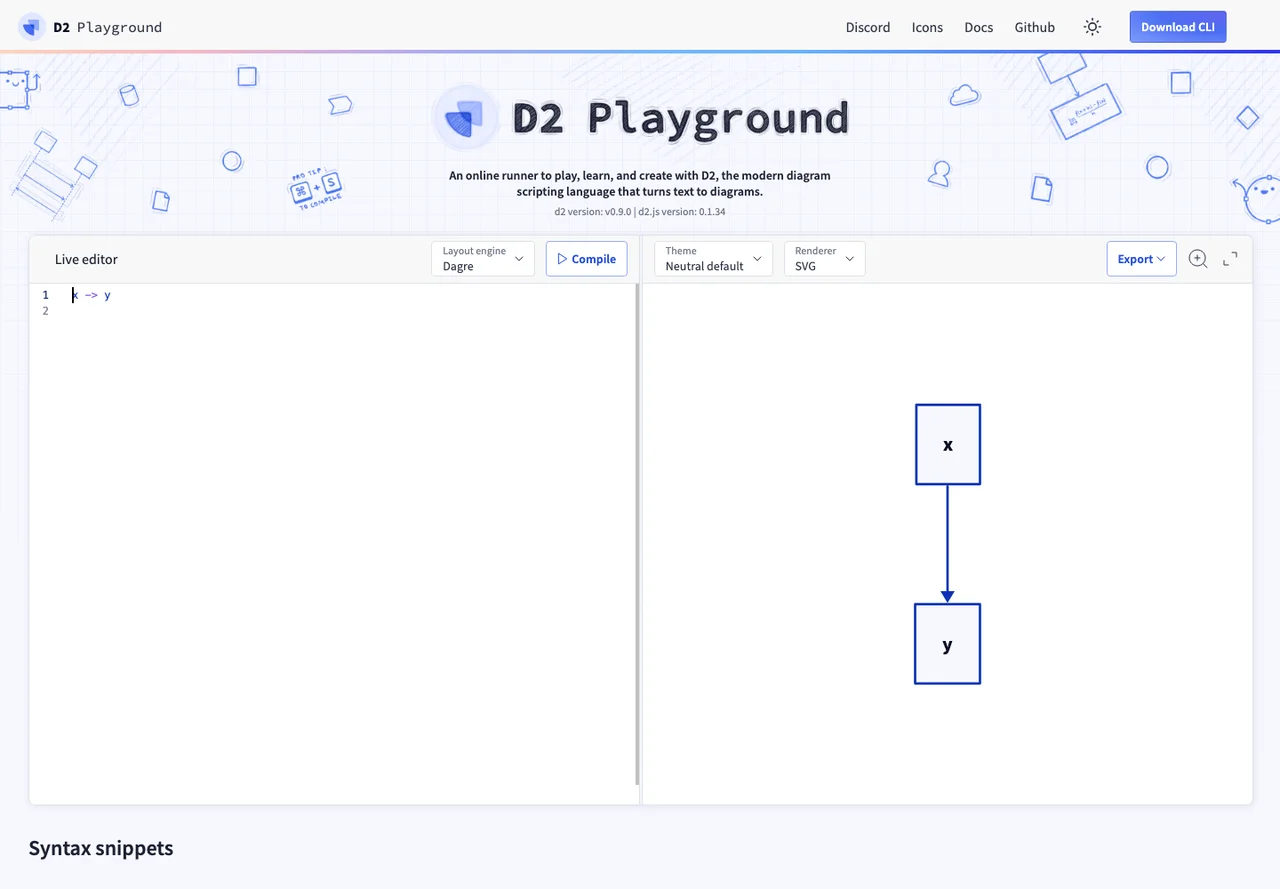
Render a D2 text diagram in a browser workspace